Hi,
I want to add formatters using the jQuery sparklines plugin as described for Tabulator.js here:
The approach I followed is similar to the one used for adding javascript code for an editor as done here: Custom js editor for Tabulator
This seems to work in Jupyter Lab (sometimes) and not work in jupyter notebook and voila. (Possibly due to not using require.js)
Here is what I tried:
RAW_JS_SCRIPT = '''

//Formatter to generate line chart
var lineFormatter = function(cell, formatterParams, onRendered){
    onRendered(function(){ //instantiate sparkline after the cell element has been aded to the DOM
        $(cell.getElement()).sparkline(cell.getValue(), {width:"100%", type:"line", disableTooltips:true});
    });
};

//generate bar chart
var barFormatter = function(cell, formatterParams, onRendered){
    onRendered(function(){ //instantiate sparkline after the cell element has been aded to the DOM
        $(cell.getElement()).sparkline(cell.getValue(), {width:"100%", type:"bar", barWidth:14, disableTooltips:true});
    });
};

//generate discrete chart
var tristateFormatter = function(cell, formatterParams, onRendered){
    onRendered(function(){ //instantiate sparkline after the cell element has been aded to the DOM
        $(cell.getElement()).sparkline(cell.getValue(), {width:"100%", type:"tristate", barWidth:14, disableTooltips:true});
    });
};


//generate box plot
var boxFormatter = function(cell, formatterParams, onRendered){
    onRendered(function(){ //instantiate sparkline after the cell element has been aded to the DOM
        $(cell.getElement()).sparkline(cell.getValue(), {width:"100%", type:"box", disableTooltips:true});
    });
};

console.log("test")
Tabulator.prototype.moduleBindings["format"].prototype.formatters['spark_line'] = lineFormatter
Tabulator.prototype.moduleBindings["format"].prototype.formatters['spark_bar'] = barFormatter
Tabulator.prototype.moduleBindings["format"].prototype.formatters['spark_tristate'] = tristateFormatter
Tabulator.prototype.moduleBindings["format"].prototype.formatters['spark_box'] = boxFormatter
console.log(Tabulator.prototype.moduleBindings["format"].prototype.formatters)
'''
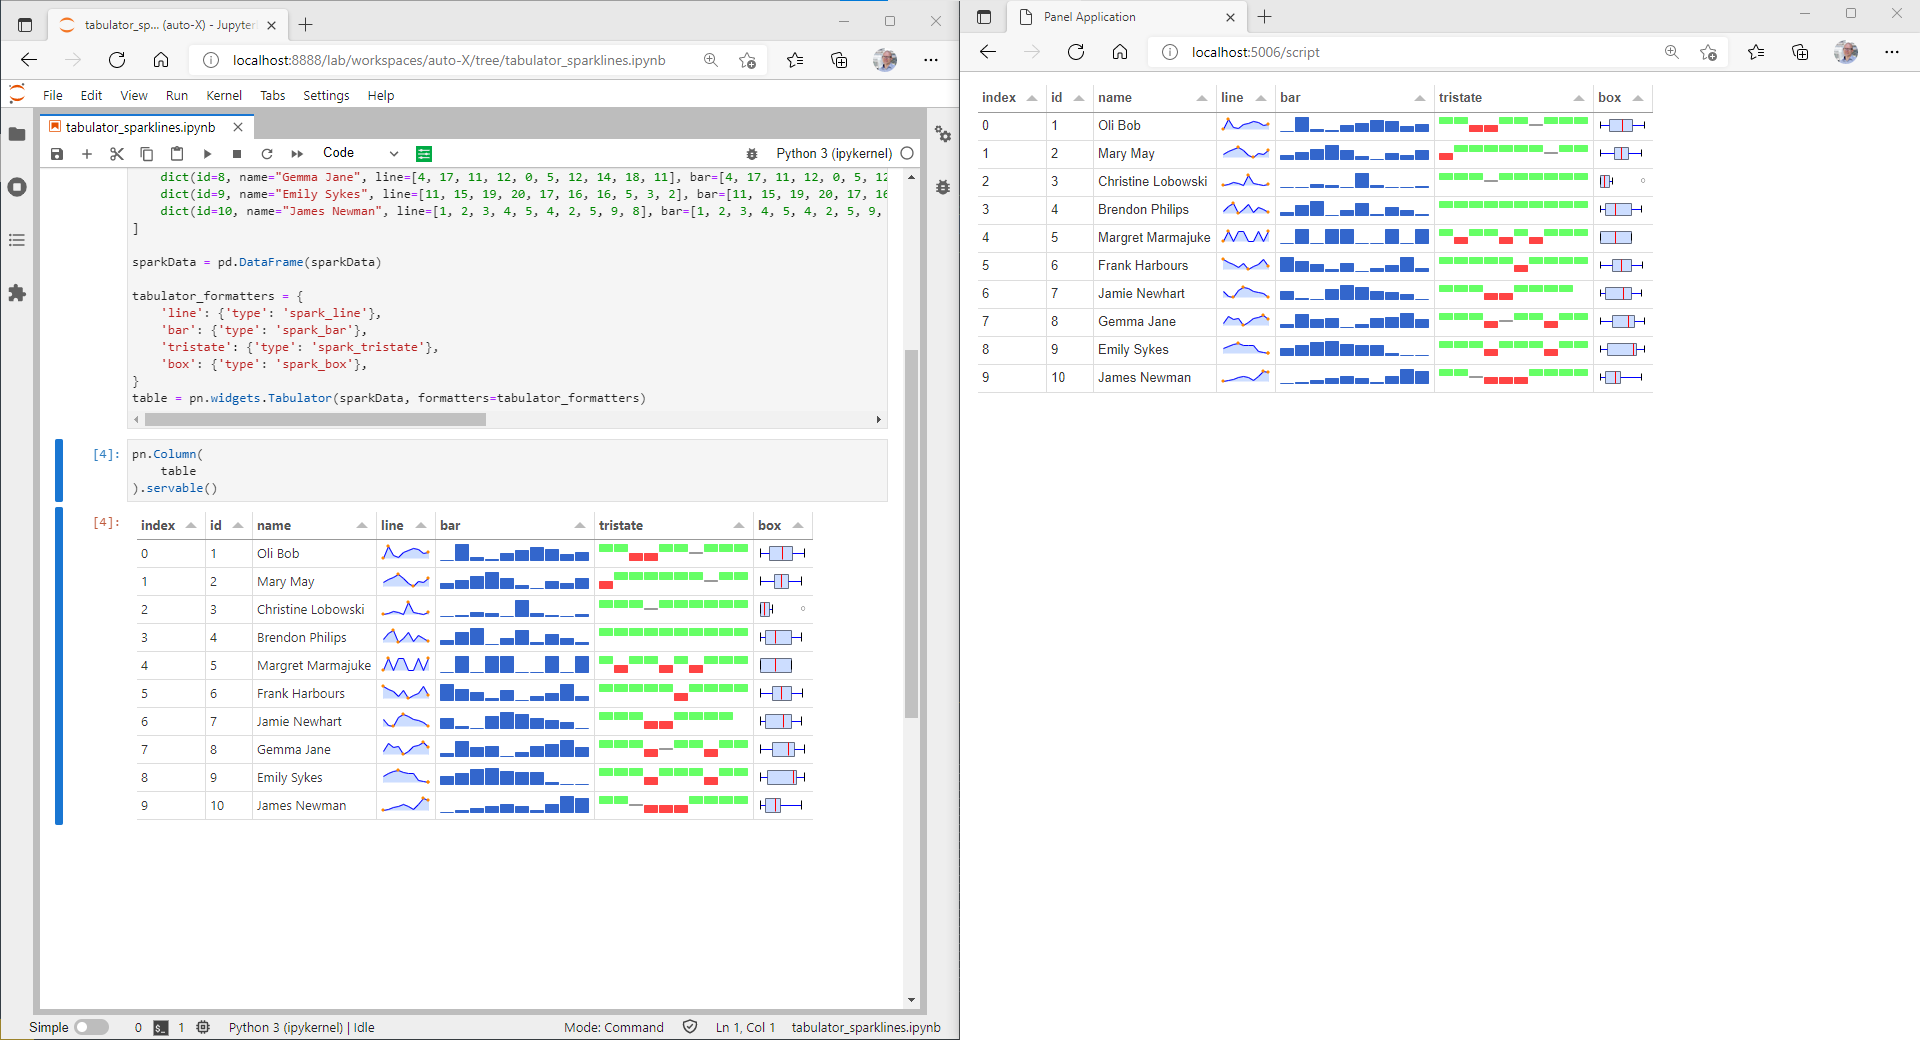
Here is the full code:
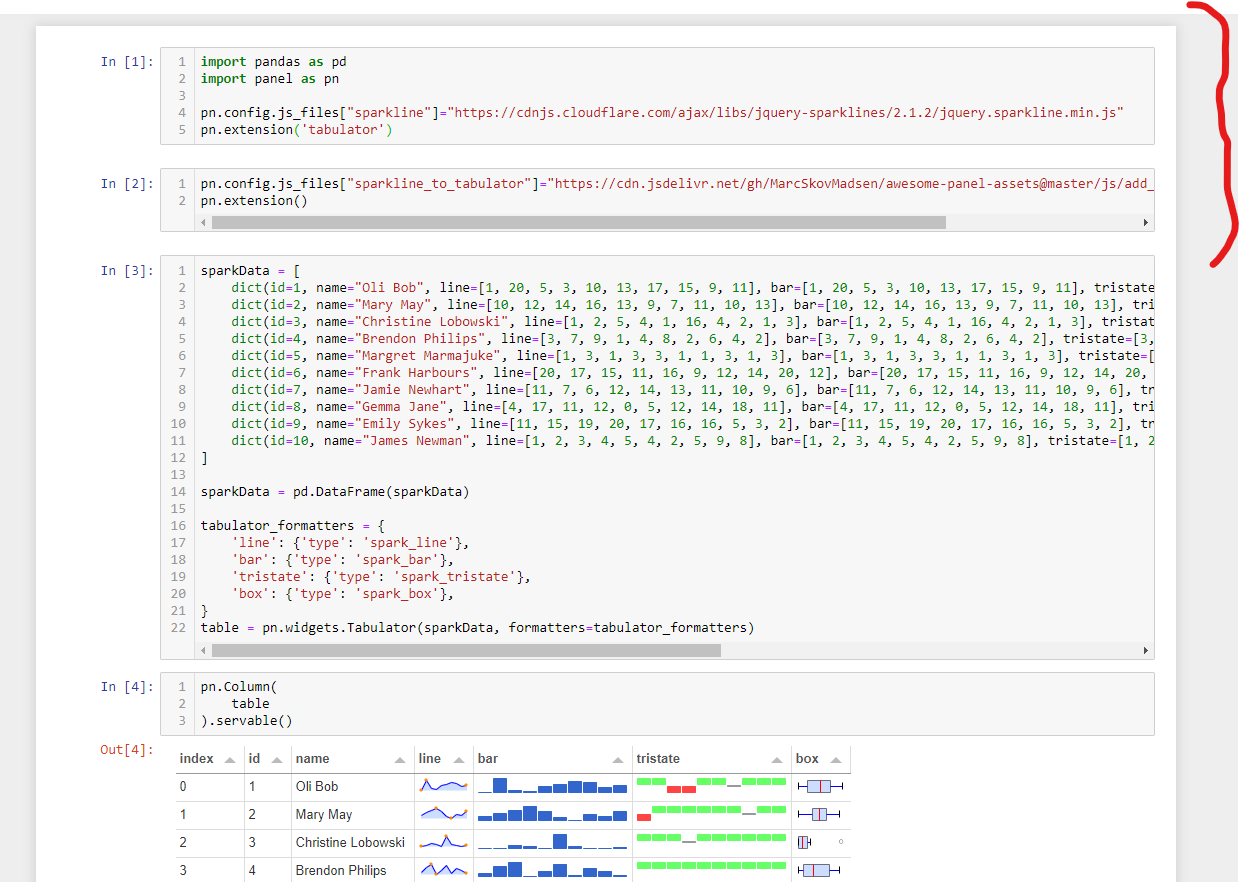
import datetime as dt
import pandas as pd
import panel as pn
pn.extension('tabulator')
RAW_JS_SCRIPT = '''
//Formatter to generate line chart
var lineFormatter = function(cell, formatterParams, onRendered){
onRendered(function(){ //instantiate sparkline after the cell element has been aded to the DOM
$(cell.getElement()).sparkline(cell.getValue(), {width:"100%", type:"line", disableTooltips:true});
});
};
//generate bar chart
var barFormatter = function(cell, formatterParams, onRendered){
onRendered(function(){ //instantiate sparkline after the cell element has been aded to the DOM
$(cell.getElement()).sparkline(cell.getValue(), {width:"100%", type:"bar", barWidth:14, disableTooltips:true});
});
};
//generate discrete chart
var tristateFormatter = function(cell, formatterParams, onRendered){
onRendered(function(){ //instantiate sparkline after the cell element has been aded to the DOM
$(cell.getElement()).sparkline(cell.getValue(), {width:"100%", type:"tristate", barWidth:14, disableTooltips:true});
});
};
//generate box plot
var boxFormatter = function(cell, formatterParams, onRendered){
onRendered(function(){ //instantiate sparkline after the cell element has been aded to the DOM
$(cell.getElement()).sparkline(cell.getValue(), {width:"100%", type:"box", disableTooltips:true});
});
};
console.log("test")
Tabulator.prototype.moduleBindings["format"].prototype.formatters['spark_line'] = lineFormatter
Tabulator.prototype.moduleBindings["format"].prototype.formatters['spark_bar'] = barFormatter
Tabulator.prototype.moduleBindings["format"].prototype.formatters['spark_tristate'] = tristateFormatter
Tabulator.prototype.moduleBindings["format"].prototype.formatters['spark_box'] = boxFormatter
'''
pn.pane.HTML('<script src="https://cdnjs.cloudflare.com/ajax/libs/jquery-sparklines/2.1.2/jquery.sparkline.min.js"></script>')
pn.pane.HTML(f"<script type='text/javascript'>{RAW_JS_SCRIPT}</script>")
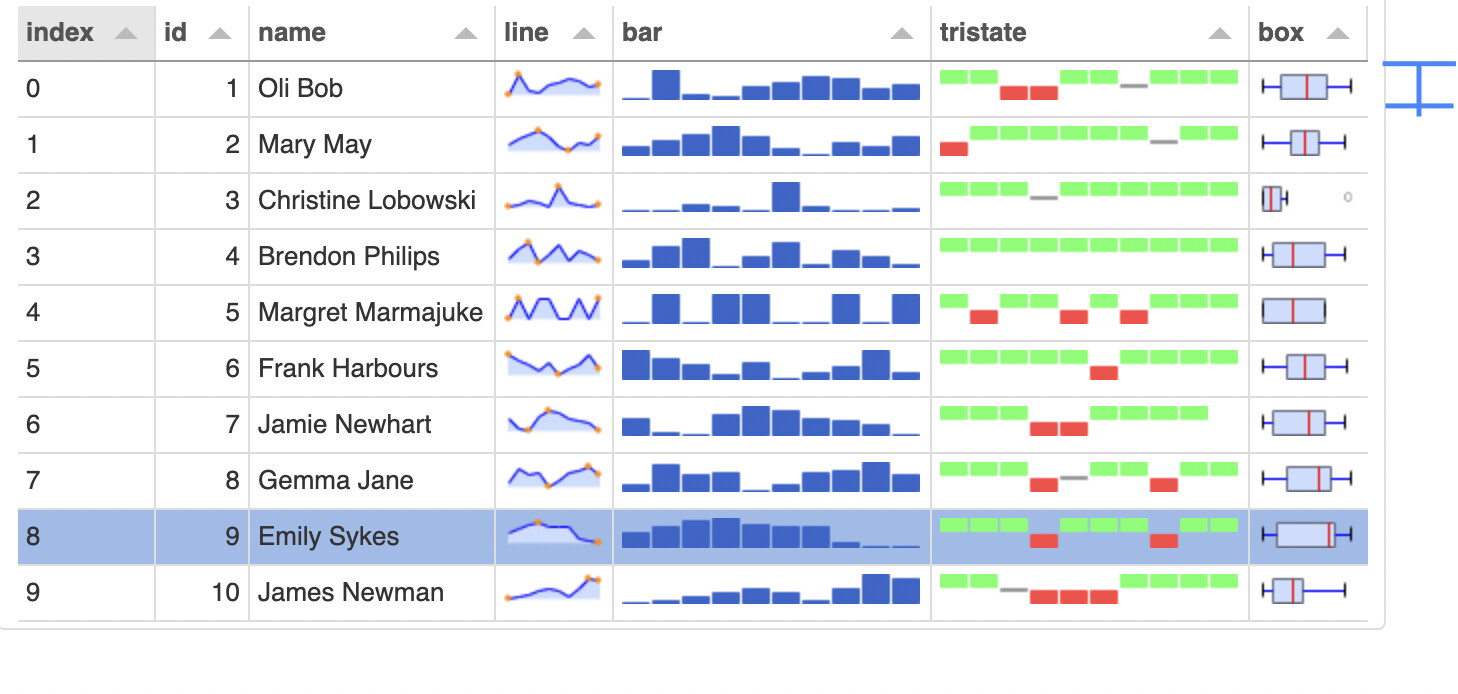
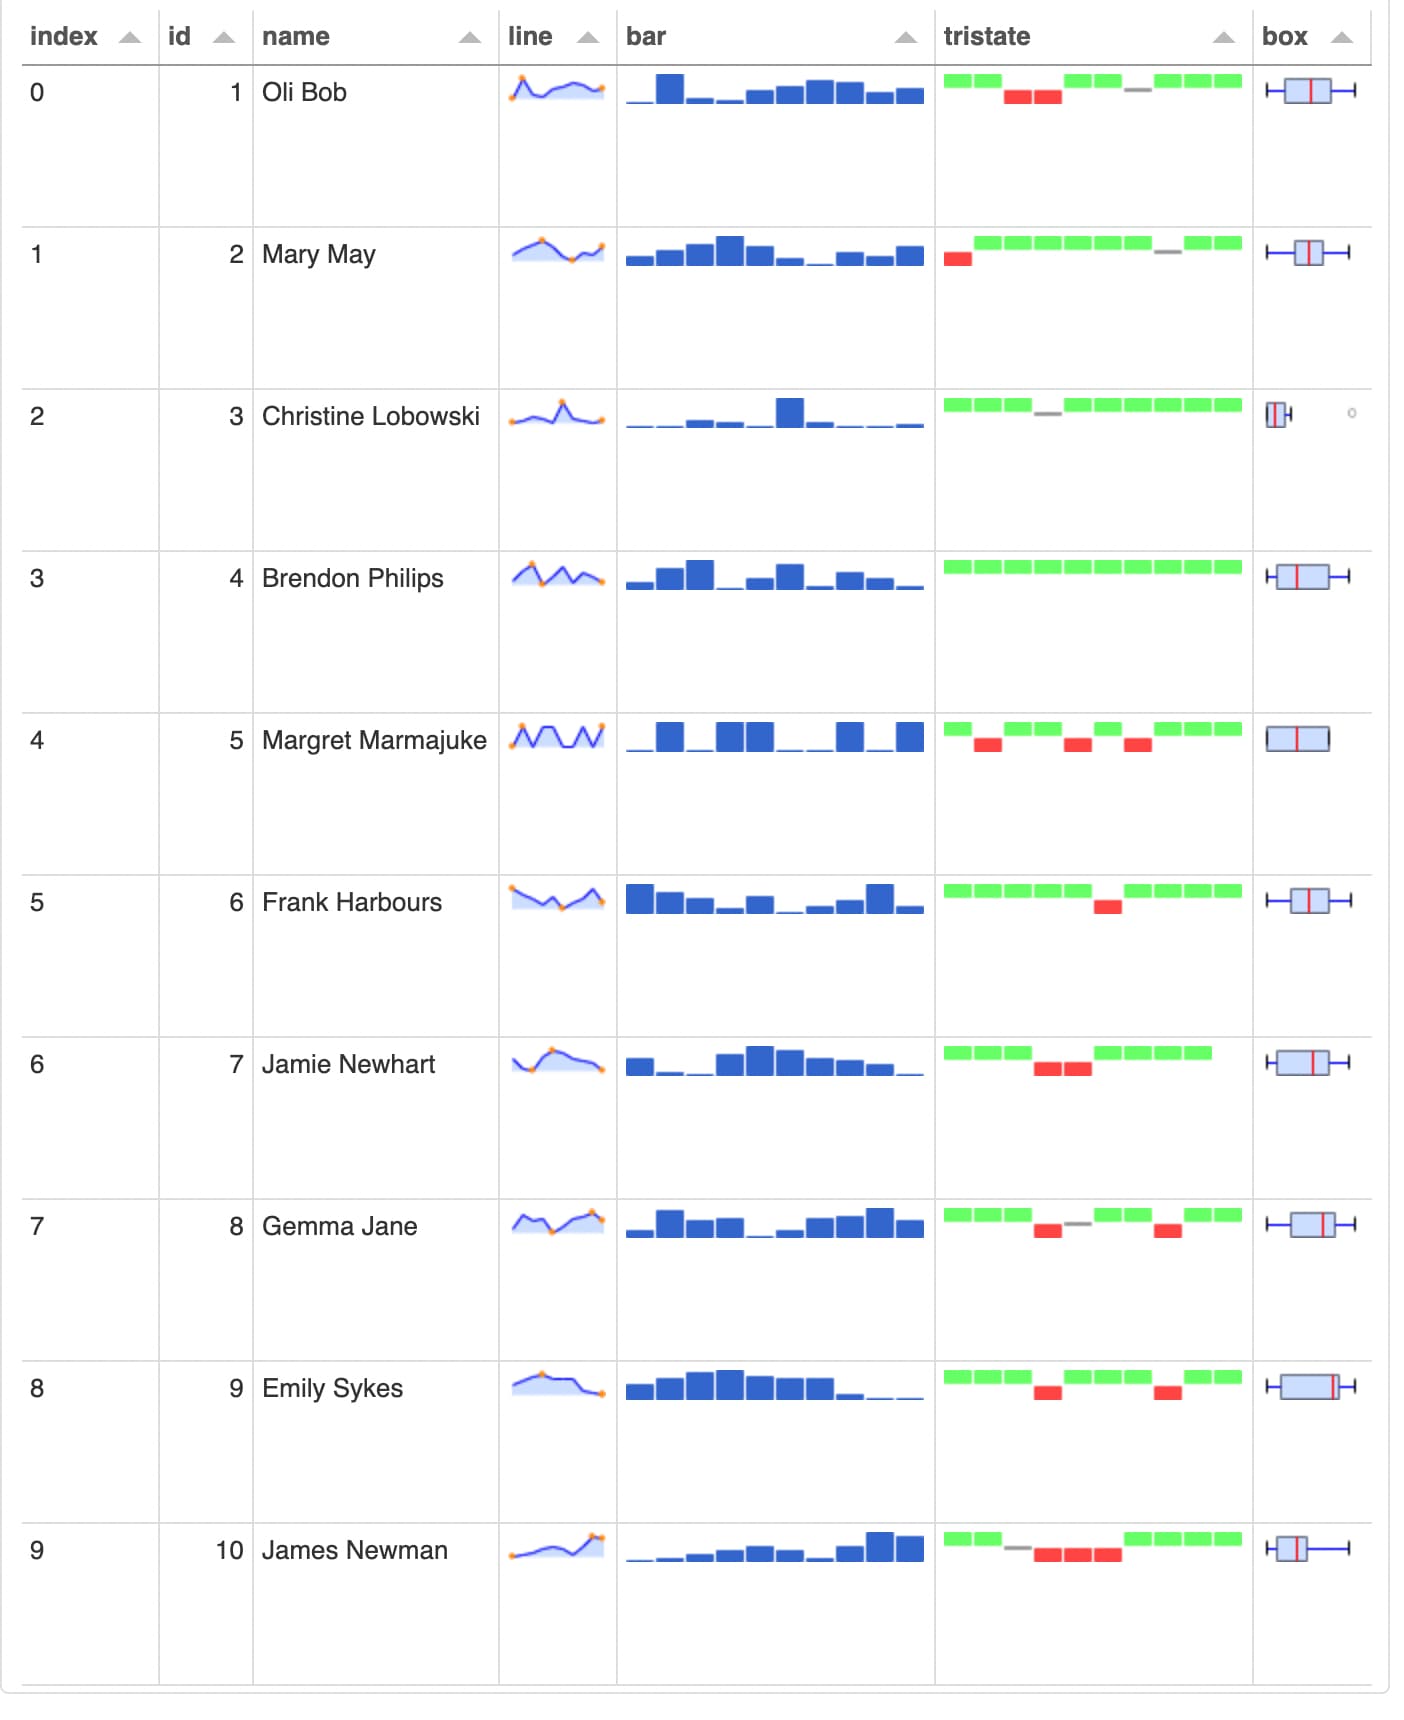
sparkData = [
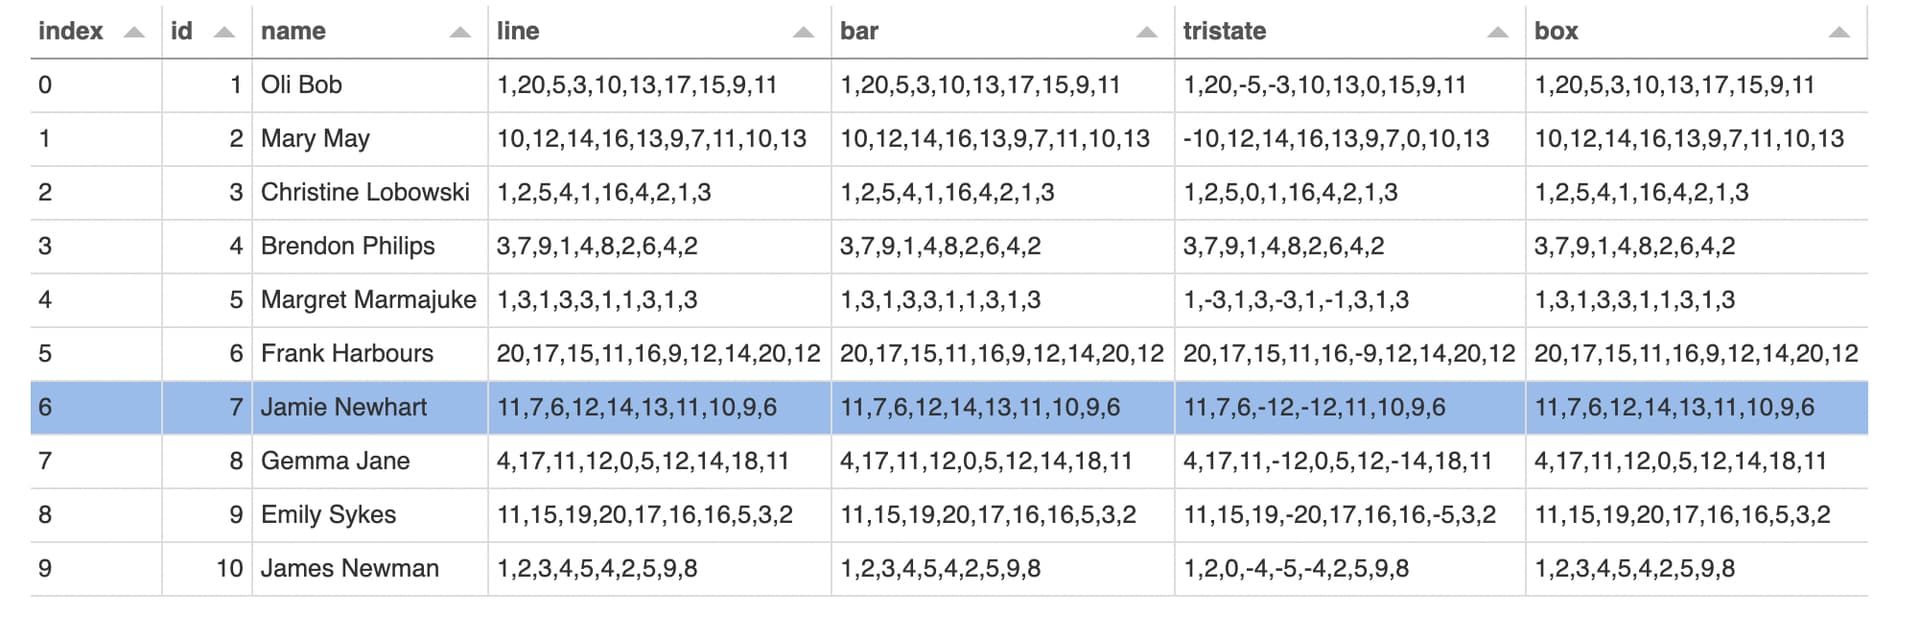
dict(id=1, name="Oli Bob", line=[1, 20, 5, 3, 10, 13, 17, 15, 9, 11], bar=[1, 20, 5, 3, 10, 13, 17, 15, 9, 11], tristate=[1, 20, -5, -3, 10, 13, 0, 15, 9, 11], box=[1, 20, 5, 3, 10, 13, 17, 15, 9, 11]),
dict(id=2, name="Mary May", line=[10, 12, 14, 16, 13, 9, 7, 11, 10, 13], bar=[10, 12, 14, 16, 13, 9, 7, 11, 10, 13], tristate=[-10, 12, 14, 16, 13, 9, 7, 0, 10, 13], box=[10, 12, 14, 16, 13, 9, 7, 11, 10, 13]),
dict(id=3, name="Christine Lobowski", line=[1, 2, 5, 4, 1, 16, 4, 2, 1, 3], bar=[1, 2, 5, 4, 1, 16, 4, 2, 1, 3], tristate=[1, 2, 5, 0, 1, 16, 4, 2, 1, 3], box=[1, 2, 5, 4, 1, 16, 4, 2, 1, 3]),
dict(id=4, name="Brendon Philips", line=[3, 7, 9, 1, 4, 8, 2, 6, 4, 2], bar=[3, 7, 9, 1, 4, 8, 2, 6, 4, 2], tristate=[3, 7, 9, 1, 4, 8, 2, 6, 4, 2], box=[3, 7, 9, 1, 4, 8, 2, 6, 4, 2]),
dict(id=5, name="Margret Marmajuke", line=[1, 3, 1, 3, 3, 1, 1, 3, 1, 3], bar=[1, 3, 1, 3, 3, 1, 1, 3, 1, 3], tristate=[1, -3, 1, 3, -3, 1, -1, 3, 1, 3], box=[1, 3, 1, 3, 3, 1, 1, 3, 1, 3]),
dict(id=6, name="Frank Harbours", line=[20, 17, 15, 11, 16, 9, 12, 14, 20, 12], bar=[20, 17, 15, 11, 16, 9, 12, 14, 20, 12], tristate=[20, 17, 15, 11, 16, -9, 12, 14, 20, 12], box=[20, 17, 15, 11, 16, 9, 12, 14, 20, 12]),
dict(id=7, name="Jamie Newhart", line=[11, 7, 6, 12, 14, 13, 11, 10, 9, 6], bar=[11, 7, 6, 12, 14, 13, 11, 10, 9, 6], tristate=[11, 7, 6, -12, 1-13, 11, 10, 9, 6], box=[11, 7, 6, 12, 14, 13, 11, 10, 9, 6]),
dict(id=8, name="Gemma Jane", line=[4, 17, 11, 12, 0, 5, 12, 14, 18, 11], bar=[4, 17, 11, 12, 0, 5, 12, 14, 18, 11], tristate=[4, 17, 11, -12, 0, 5, 12, -14, 18, 11], box=[4, 17, 11, 12, 0, 5, 12, 14, 18, 11]),
dict(id=9, name="Emily Sykes", line=[11, 15, 19, 20, 17, 16, 16, 5, 3, 2], bar=[11, 15, 19, 20, 17, 16, 16, 5, 3, 2], tristate=[11, 15, 19, -20, 17, 16, 16, -5, 3, 2], box=[11, 15, 19, 20, 17, 16, 16, 5, 3, 2]),
dict(id=10, name="James Newman", line=[1, 2, 3, 4, 5, 4, 2, 5, 9, 8], bar=[1, 2, 3, 4, 5, 4, 2, 5, 9, 8], tristate=[1, 2, 0, -4, -5, -4, 2, 5, 9, 8], box=[1, 2, 3, 4, 5, 4, 2, 5, 9, 8]),
]
sparkData = pd.DataFrame(sparkData)
tabulator_formatters = {
'line': {'type': 'spark_line'},
'bar': {'type': 'spark_bar'},
'tristate': {'type': 'spark_tristate'},
'box': {'type': 'spark_box'},
}
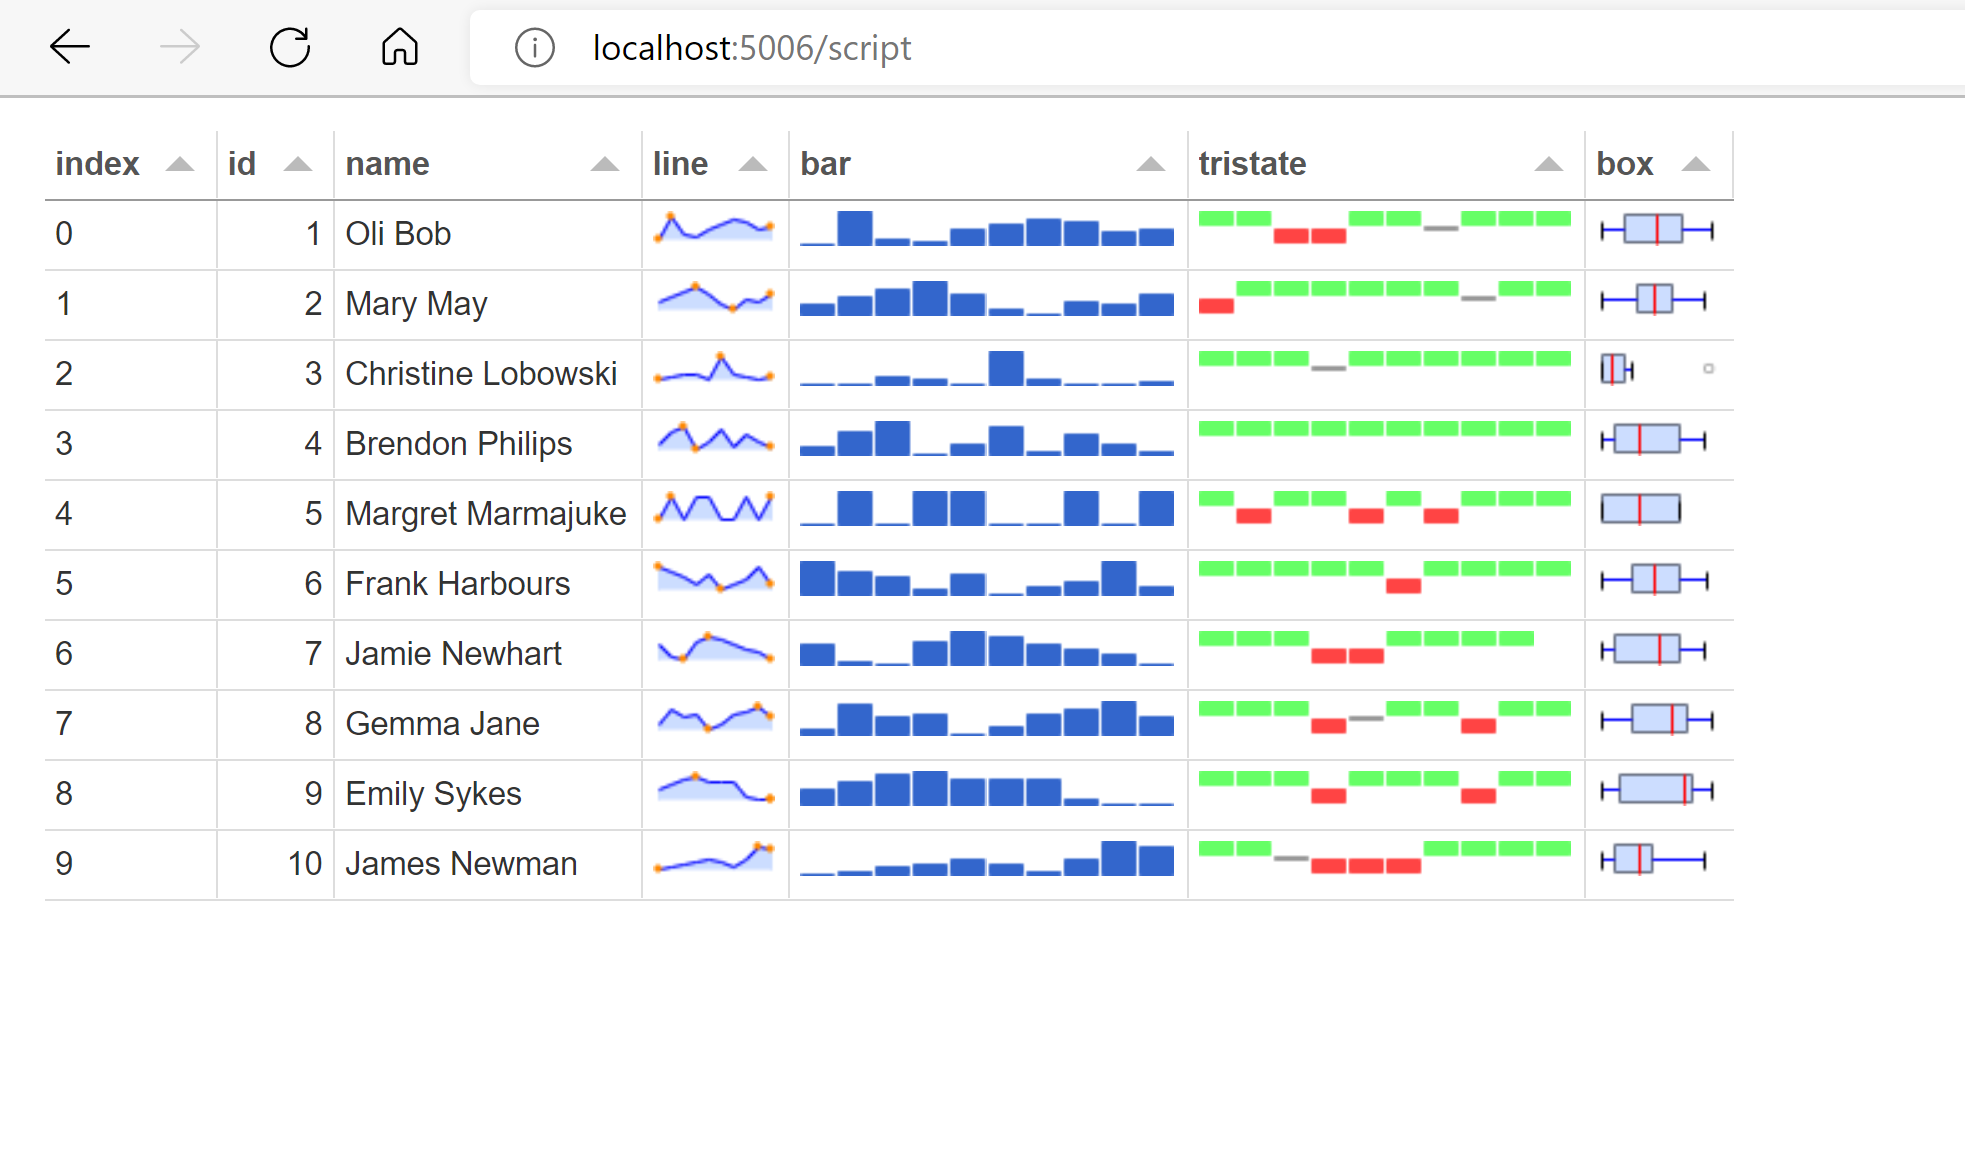
pn.widgets.Tabulator(sparkData, formatters=tabulator_formatters)

What would be the right approach to do this to make sparklines work everywhere?