Hello everyone,
I have two figures side by side. They are two independent figures because they show two different things. I understand that Holoview checks if the axes are the same or not, and accordingly axes will be shared. But in this situation, I dont want them to be shared.
You can see here that y-axis is shared, and second figure is clipping my data.
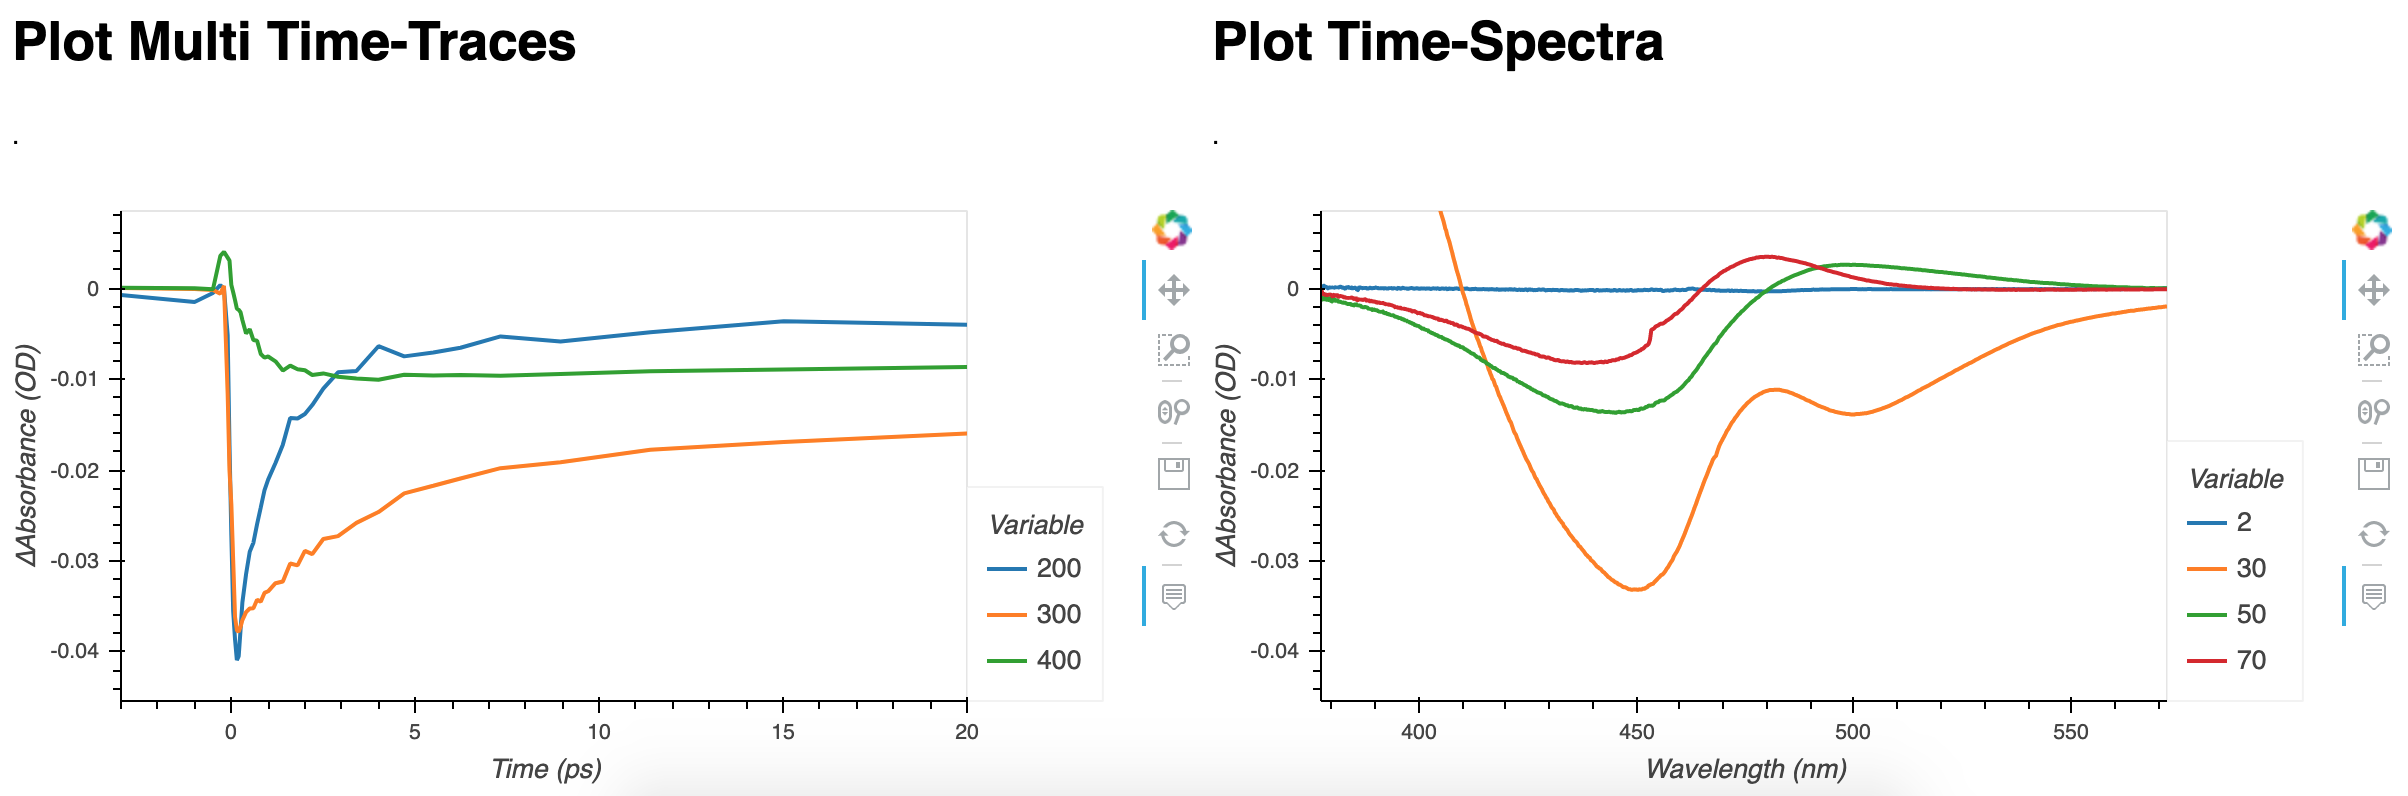
I added opts.(axiswise=True) command for both figures but no chance. Firstly, I realized that X axis of both figures have the same name. I modified one of them, so x-axis is not shared anymore. However, I cannot break y-axis sharing, although they do not have the same y-axis name…
Maybe you can help me out 
This is my code;
import pandas as pd
import numpy as np
import panel as pn
import matplotlib.pyplot as plt
import hvplot.pandas
from matplotlib.figure import Figure
from matplotlib.backends.backend_agg import FigureCanvas
from decimal import Decimal

pn.extension()

%matplotlib inline
%matplotlib notebook

# Global variables
fig_width = 600
fig_height = 300

d = np.genfromtxt('visdata.dat', delimiter='\t')
row_data = pd.DataFrame(data=d[0:,0:])
d1 = row_data.iloc[1:,0:] # we use this data frame for plotting time traces.

def plot_multitimtrace(pixels = ["200","300","400"]):
    fig = d1.hvplot.line(x='0',
                         y=pixels,
                         xlim=(-3, 20),
                         xlabel='Time (ps)',
                         ylabel='∆Absorbance (OD)',
                         width = fig_width,
                         height = fig_height).opts(axiswise=True)
    return pn.Column(fig)

def plot_multitimspec(time = ["2", "30", "50", "70"]):
    x1= row_data.iloc[0,1:] #slicing first row of data as x-axis (which is pixels).

    y1= row_data.iloc[int(time[0]),1:] #slicing time'th' row of data as y-axis (which is defined by time)
    y2= row_data.iloc[int(time[1]),1:]
    y3= row_data.iloc[int(time[2]),1:]
    y4= row_data.iloc[int(time[3]),1:]
    data_to_plot = pd.concat([x1, y1, y2, y3, y4], axis=1)
    mapping = {data_to_plot.columns[0]:'wl'}
    data_to_plot = data_to_plot.rename(columns=mapping)
    fig = data_to_plot.hvplot.line(x='wl',
                                  y=time,
                                  xlabel='Wavelength (nm)',
                                  ylabel='∆Absorbance (OD)',
                                  width = fig_width,
                                  height = fig_height).opts(axiswise=True)
    return pn.Column(fig)

graph3 = pn.Column("<br>\n#Plot Multi Time-Traces\n.", pn.interact(plot_multitimtrace))
graph4 = pn.Column("<br>\n#Plot Time-Spectra\n.",pn.interact(plot_multitimspec))

p = pn.Row(graph3, graph4)
p I want to understand those concepts (layers, panels) better. I am reading the documentation of panel and holoview but I feel sometimes lost. Some stuff are still a little bit abstract to me…