hvplot 0.8.0
bokeh 2.4.3
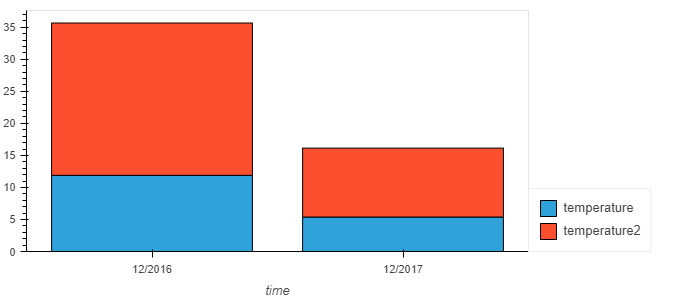
Formatting datetime x-axis ticks on a stacked bar plot works without any problem:
import hvplot.pandas
from bokeh.sampledata.sea_surface_temperature import sea_surface_temperature as df
from bokeh.models import DatetimeTickFormatter

df['temperature2'] = 2*df['temperature']
df = df.resample('1Y').mean()
print(df)

df.hvplot.bar(stacked=True).opts(xformatter=DatetimeTickFormatter(months=['%m/%Y'], years = ['%m/%Y']))
                             temperature  temperature2
time
2016-12-31 00:00:00+00:00    11.890157     23.780314
2017-12-31 00:00:00+00:00     5.380842     10.761684
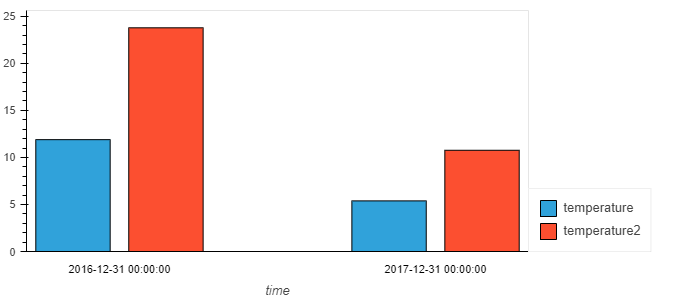
However, when I display the bars side by side instead, the tick formatting is not applied anymore:
df.hvplot.bar(stacked=False).opts(multi_level=False, xformatter=DatetimeTickFormatter(months=['%m/%Y'], years = ['%m/%Y']))
Is it that I am doing something wrong here, or might it be a bug?