Hi @seanlaw !
Yes this has to do with the axis of a bar plot being categorical (here you’ve got numbers, but you could have an axis that is something like ['Appled', 'Banana', 'Pear']).
There’s another workaround to this issue. hvplot returns objects that are holoviews objects which are not plots but wrappers around your data, and that when displayed in a notebook are turned into plots. That’s a major difference with Matplotlib for instance, with which you get a plot object (Figure/Axes) and can’t do anything with your data anymore. It happens that holoviews objects can be indexed/sliced (Indexing and Selecting Data — HoloViews 1.14.5 documentation), most of its objects support the familiar .iloc method:
import numpy as np
import pandas as pd
import hvplot.pandas
n = 10
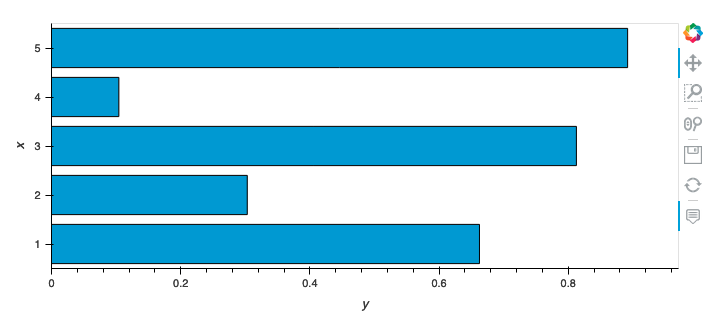
tmp_df = pd.DataFrame({"x": np.arange(n) + 1, "y": np.random.rand(n)})
tmp_df.hvplot.barh("x", "y").iloc[:5]
But anyway, I think that xlim having no effect here is an issue and that it should be fixed, either in holoviews or hvplot directly.