Hi! My struggle with Altair and Panel widget continue  , I’m trying to create an Altair chart and control It with different widgets, at first stage using a Date Select Slider, based on this tutorial (https://towardsdatascience.com/how-to-build-a-time-series-dashboard-in-python-with-panel-altair-and-a-jupyter-notebook-c0ed40f02289) code I tried to build this function as first step:
`
#The Dashboard Function
import pandas as pd
import panel as pn
import numpy as np
import altair as alt
from vega_datasets import data
from dateutil.parser import parse
from altair import datum
def ts_dashboard(dtf, resolution, date_col, col_to_analyse):
title = '### *_TimeSeries Dashboard_*'
for res in resolution:
    tickers = dtf[res].unique()
ticker = pn.widgets.Select(name=str(resolution), options=list(tickers))
date_range_slider = pn.widgets.DateRangeSlider(
    name='Date Range Slider',
    start=parse(dtf[date_col][0]), end=parse(dtf[date_col][len(dtf) - 1]),
    value=(parse(dtf[date_col][0]), parse(dtf[date_col][len(dtf) - 1]))
)
@pn.depends(ticker.param.value, date_range_slider.param.value)
def get_plot(ticker_val, data_range):
    data = dtf
    data[date_col] = pd.to_datetime(data[date_col])
    start_date = data_range[0]
    end_date = data_range[1]
    mask = (data[date_col] > start_date) & (data[date_col] <= end_date)
    data = data.loc[mask]
    # pylint:disable=(undefined-loop-variable)
    chart = alt.Chart(data).mark_area(color="#0c1944", opacity=0.8)\
        .encode(x=date_col, y=col_to_analyse,
                tooltip=alt.Tooltip([date_col, col_to_analyse]))\
        .transform_filter((datum[res] == ticker_val))
    return chart
return get_plot, title, ticker, date_range_slider

#Test DataFrame

source = data.stocks()
source = pd.DataFrame(source)
#Panel Object and Deployement

plot, title, ticker, date_range_slider =ts_dashboard(source,['symbol'],'date','price')
dashboard=pn.Row(pn.Column(title, ticker,date_range_slider),
             plot).show()`
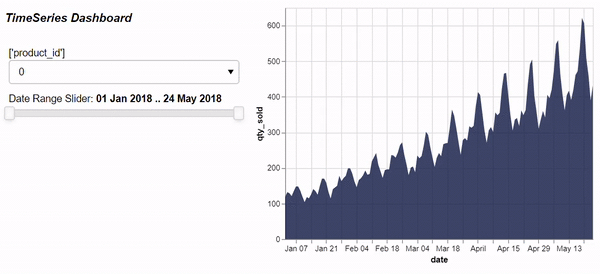
It works just fine in Jupyter Notebook, but unfortunately , using Pycharm the Chart does not interact with the date slider, as shown below :
I would like to integrate this dashboard as part pf my panel App, and I’m using Pycharm to do so, but I don’t really know what I missed up, I cheked the pachages version, and they are the same in JupyterNootebook and Pycharm, I also used alt.renderers.enable(‘altair_viewer’), as suggested in Altair Doc as well but nothing seem to work, I’m really confused about this, could you guide me please 