Hi, I’m a little confused regarding the use of hv.dim. Consider the following example:
hv.Scatter([[1, 1, 70], [2, 2, 90]], vdims=["y", "color"]
    ).opts(color=hv.dim('color').norm(limits=(30, 100)), size=25, cmap="RdYlBu_r") +\
hv.Scatter([[1, 1, 70], [2, 2, 90]], vdims=["y", "color"]
    ).opts(color='color', size=25, cmap="RdYlBu_r").redim.range(color=(30, 100))
Which produces:
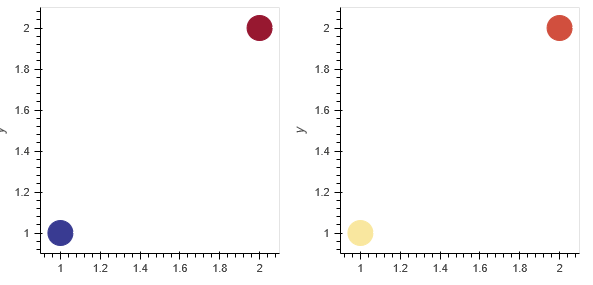
Why does the first plot not come out correctly? I’m sure I’m missing some stupid little thing.