Embed panel with datepicker widget

Hi,
I have made a panel which uses the datepicker widget as input for a histogram.
By selecting a date, you can get the respective histogram for that specific day.

panel.servable()

I have tried embeddig the widget like so:

panel.embed()

or

panel.save(‘test.html’, embed = True)

unfortunately to no avail. I read in another thread that daterange doesn’t work as it you can’t embed the range options with panel as the input needs to be discreet. Does the same limitation also apply here? I had hoped a single date input would qualifies.

@guido, welcome to the discourse! I’ve gotten a lot of great tips and support here, and I’m sure you’ll find the same.

It would help tremendously if you could provide a minimal example of your current code and describe specifically what is not working.

I’ve had success using a DiscreteSlider widget to select dates which dynamically update plots. With a bit more clarity on your current code and desired outcome, I could see if my solution would work for you.

Best,
Charles

2 Likes

Hi @cisaacstern, thank you for your kind words.

My code is as below, I have a data frame deals preloaded.

# define widget
date_picker = pn.widgets.DatePicker(name='Date Picker',                                     
                                    start=deals.sort_index().index[0].date(), 
                                    end=deals.sort_index().index[-1].date(), 
                                    value=deals.sort_index().index[-1].date()
                                   )

# create function
def hourly_plot(date):
    df = deals.loc[date]
    hist = px.histogram(df, x='Uur', y='MWh',color = 'Type', histfunc="sum", title="intraday Hourly flow")
    return hist

# define panel
hourly  = pn.Row(
    pn.Column(date_picker),    
    hourly_plot(date_picker.value)
)

# callback
def hourly_plot_update(event):
    hourly[1].object = hourly_plot(date_picker.value)
date_picker.param.watch(hourly_plot_update, 'value') #update or replace

hourly.servable()

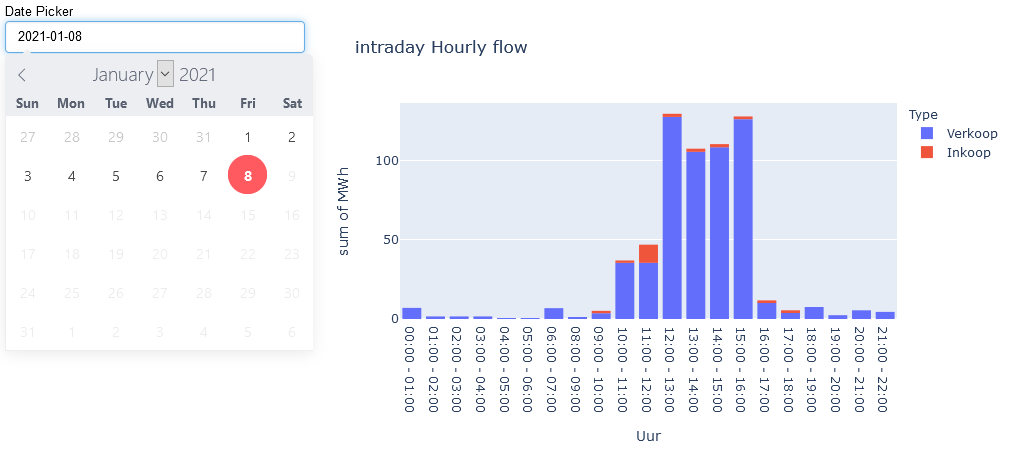
It comes out like so:

In the next cell I use either hourly.embed() or hourly.save('hourly.html', embed = True) but the command doesn’t run through all the different states. Doing a similar routine but with the ‘Select’ widget, it does save the different states to the output which i can share easily in a HTML.

Hope you or anyone else can make a bit a sense of the situation!

1 Like

Hi @guido, thanks for these details.

Here is a working example I wrote which should accomplish what you describe: https://gist.github.com/cisaacstern/60ea39c273f074bd83e83cd76e96ec82

Here is what the above example looks like when deployed via panel serve histogram.py --show:

The main differences from your code are:

  1. Using the @pn.depends decorator to implement callbacks
  2. Embedding the hourly_plot function object into the pn.Row (no parentheses () after the function name)
  3. Making sure that the return object of the hourly_plot function is of type <class 'matplotlib.figure.Figure'> or equivalent.

Note the only dependencies for my example should be:

Python 3.7.9
Panel 0.10.2
Pandas 1.2.0

Please let me know how it goes and, if any other questions arise, how I can help resolve them.

Best,
Charles

1 Like

@cisaacstern Thanks for providing the detailed answer, it’s the only thing that will work currently! The problem is that @guido is asking about a feature called embedding in Panel, which allows Panel to embed the entire state space of an application into an HTML file or a set of JSON files shipped alongside the exported HTML. That said in this case this is problematic because embedding only works for certain widgets where the state space is relatively small. Currently this is not implemented for DatePicker because the state space is potentially huge, but in certain cases I imagine the state space could be small enough to be tractable. So @guido, I’d encourage you to file an issue requesting that we enable embedding support for the DatePicker widget.

3 Likes

Hi @cisaacstern, thank you so much for taking the time to generate an example. I did take away some new insights in making a cleaner code using pn.depends.

# define widget
date_picker = pn.widgets.DatePicker(name='Date Picker',                                     
                                    start=deals.sort_index().index[0].date(), 
                                    end=deals.sort_index().index[-1].date(), 
                                    value=deals.sort_index().index[-1].date())

# create function
@pn.depends(date_picker.param.value)
def hourly_plot(date=date_picker.param.value):
    df = deals.loc[pd.to_datetime(date)]
    hist = px.histogram(df, x='Uur', y='MWh', 
                        color = 'Type', 
                        histfunc="sum", title="Volume by hour")
    return hist

# define panel
hourly  = pn.Row(
    pn.Column(date_picker),    
    hourly_plot
)

hourly.app()

Using the .app() function is a little addition so I can have the callback functional in the jupyter notebook. Though my ultimate wish is to have it be captured in the HTML, so that I can share it with others. @philippjfr thanks for the explanation as well. I guess I am at a dead end for now.This text will be hidden

2 Likes