Example of using holoviews TapStream with Panel

is there an example of using holoviews TapStream and panel? or something similar to using any stream and panel

Hi @ahuang11

Welcome to the community.

I don’t have an example using TapStream yet. But I have one using using RangeXY. You can find it as the KickStarterDashboard in the gallery at awesome-panel.org.

The code is here https://github.com/MarcSkovMadsen/awesome-panel/blob/master/src/pages/gallery/kickstarter_dashboard/main.py

2 Likes

Here is a minimal example using the tap stream:

import panel as pn
import holoviews as hv

pn.extension()

points = hv.Points([])
stream = hv.streams.Tap(source=points, x=np.nan, y=np.nan)

@pn.depends(stream.param.x, stream.param.y)
def location(x, y):
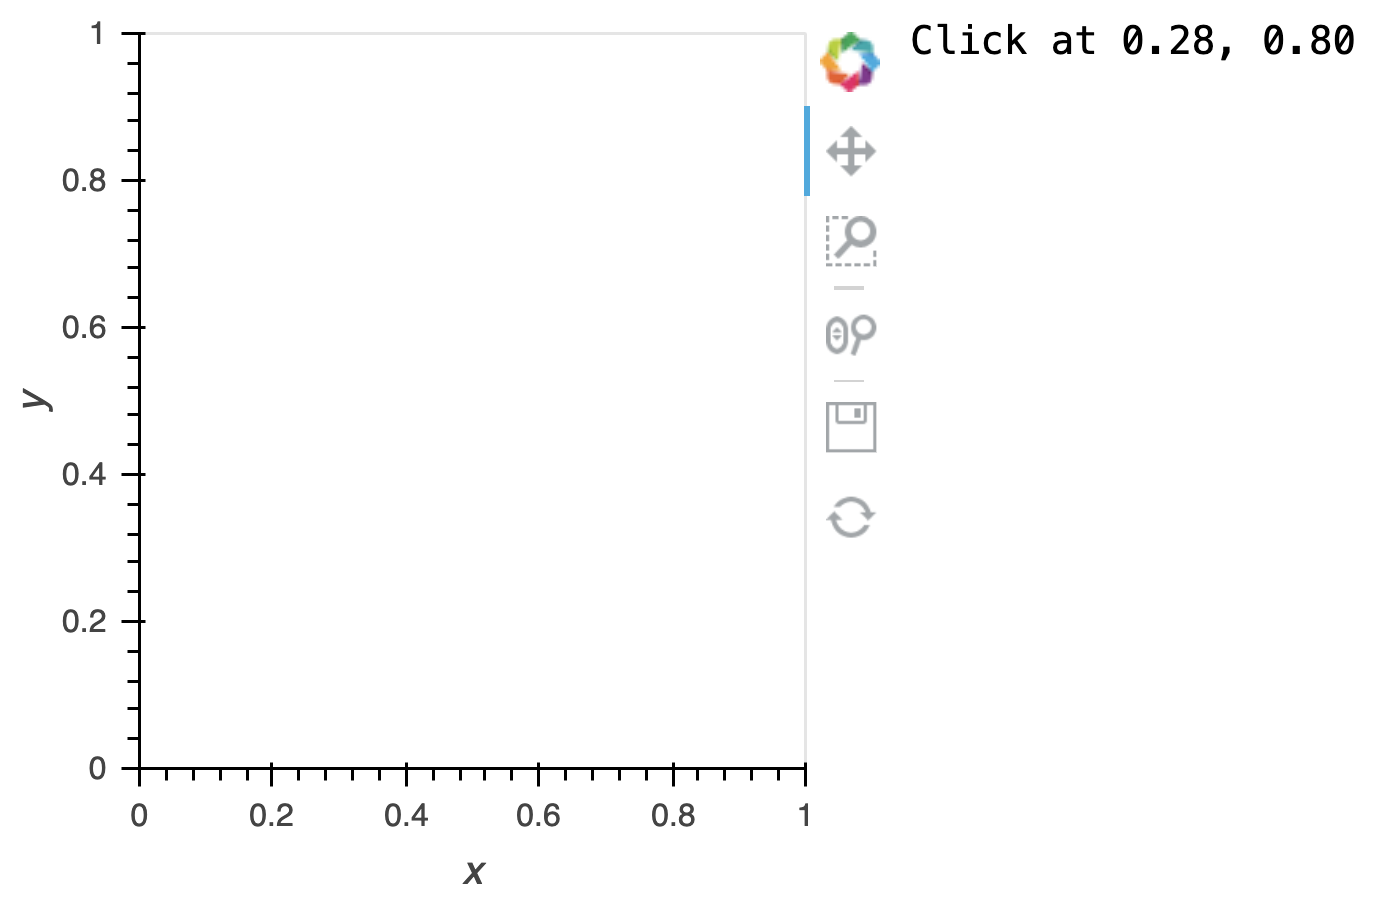
    return pn.pane.Str(f'Click at {x:.2f}, {y:.2f}', width=200)

pn.Row(points, location)

5 Likes

I think this would be useful in the docs as I’ve run into this several times and this example is much simpler than the Tap example in the holoviews docs (http://holoviews.org/reference/streams/bokeh/Tap.html). Is this something the Holoviz team would like to see added to docs? If so, let me know where and I can work on that.

1 Like

An example using the parameters API would be even better…

It took me longer then I would feel proud to say, so hoping it would help others:

Panel/Parameters/holoviews stream addition for the User Guide::Parameterized Classes::MPGExplorer example:

import param
import hvplot.pandas
from bokeh.sampledata.autompg import autompg

import panel as pn
pn.extension()

columns = list(autompg.columns[:-2])

class MPGExplorer(param.Parameterized):

    x = param.Selector(objects=columns)
    y = param.Selector(default='hp', objects=columns)
    color = param.Color(default='#0f0f0f')
    
    tap = hv.streams.SingleTap()       # Source will be linked later in the dynamic map

    @param.depends('x', 'y', 'color')
    def plot(self):
        scatter = autompg.hvplot.scatter(self.x, self.y, c=self.color, padding=0.1)
        self.tap.source = scatter          # Link the stream to the updated plot 
        return scatter
        

explorer = MPGExplorer()

pn.Row(pn.Column(explorer.param, pn.panel(explorer.tap)), explorer.plot)

6 Likes

Can you create such an example using lat lon gv.Points and hvplot for the line plot. The idea is to click on a marker on the map and use the lat lon of the marker to plot a line plot?

Something like this?
Holoviews to HoloViews — pYdeas 0.0.0 documentation

1 Like

OH MY GOD!!! Let me try it with my data and see. If this works along with my PyDeck demo, I’ll try and add it to the public doc because it is such common usecase.

UPDATE : Mr. @ahuang11 the resource you shared is very cool, I am having trouble adapting it to a rotated pole massive dataset, but I think Datashader will get me there. Thank you for your suggestion.

1 Like

You may have to project your coordinates for a rotated pole projection.

Yes that is my biggest hurdle so far is to standardize the dataset since I have RotatedPole, PolarStereo and normal PlatteCarree all of which i can load into an Xarray.Dataset, but am trying to reproject with rioxarray only to find out Holoviews has a regrid and project (still not sure how to use them. And the weirdest thing is I found out it matters in what order I load the extension of Panel, Holoviews and Hvplot depending if I want my application to work in a jupyter environment or as a Panel app (panel serve ...).Learning a lot and if you have any more tips for my use case let me know because it seems you know all the subtleties Mr. @ahuang11 .

I think you may want to use geoviews for your geographic projections.

hvplot builds on top of geoviews too; just specify crs and projection Geographic Data — hvPlot 0.8.3 documentation (holoviz.org)