I am trying to update a code I’ve done with bokeh.bkcharts and want to migrate it to HoloViews.
Here is the original code:
from bokeh.bkcharts import HeatMap, bins, output_file, show
import pandas as pd
DATA_FILE = 'samples/GSM188012.CEL'
dtype = {'x': int, 'y': int, 'lux': float}
dataset = pd.read_csv(DATA_FILE, sep='\t', dtype=dtype)
hm = HeatMap(dataset, x=bins('x'), y=bins('y'), values='lux',
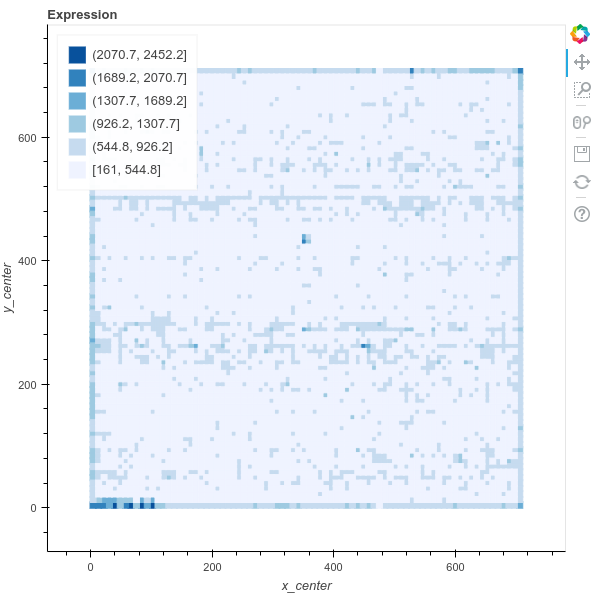
title='Expression', stat='mean')
output_file("heatmap7.html", title="heatmap.py example")
show(hm)
The data source is this file: https://github.com/Serulab/Py4Bio/blob/master/samples/GSM188012.CEL
This is the heatmap I got with this code:
And this is the new code:
import numpy as np
from pandas import read_csv
import holoviews as hv
from holoviews import opts
hv.extension('bokeh')

DATA_FILE = 'samples/GSM188012.CEL'
dtype = {'x': int, 'y': int, 'lux': float}
ds = read_csv(DATA_FILE, sep='\t', dtype=dtype)
ds = ds[['x', 'y','lux']
heatmap = hv.HeatMap(ds).aggregate(function=np.mean)
heatmap.opts(opts.HeatMap(tools=['hover'], colorbar=True, width=400, height=400, toolbar='above'))
But I don’t get something that looks similar.
I get this:
(since Discourse don’t allow me to post two images, I put the link https://github.com/Serulab/Py4Bio/blob/master/samples/bokeh_plot%20(9).png )
.png)
Is there a way to get the same plot?