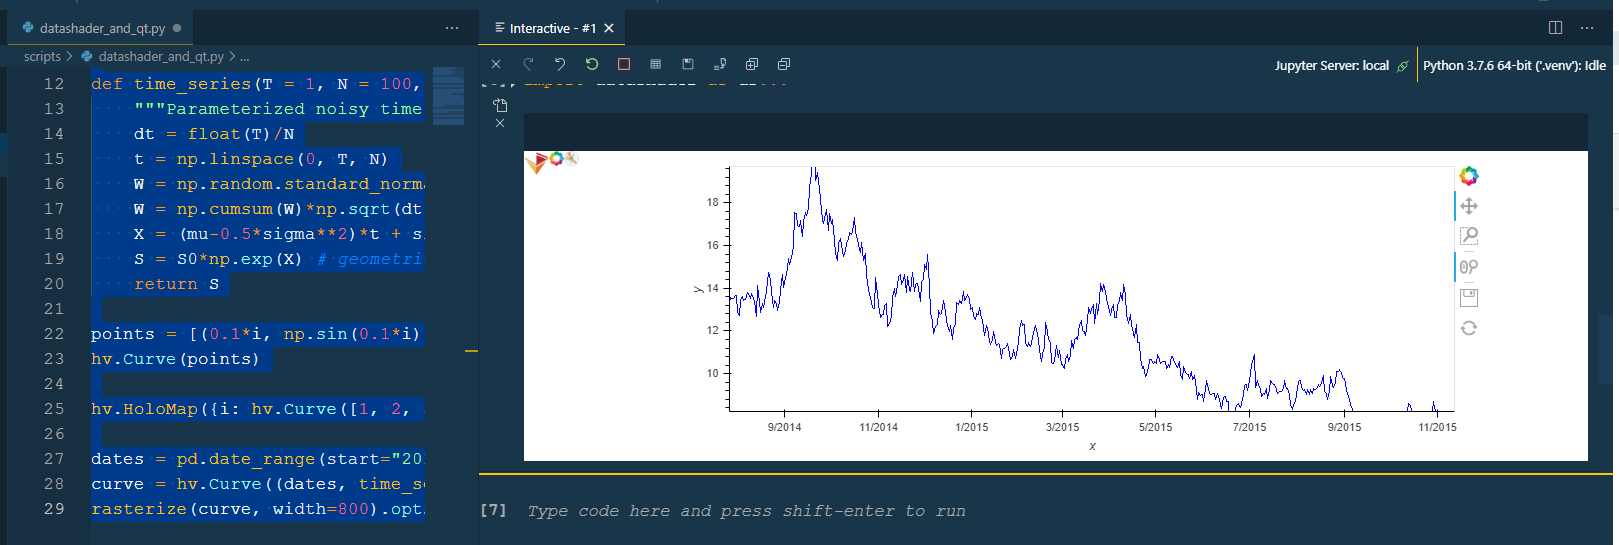
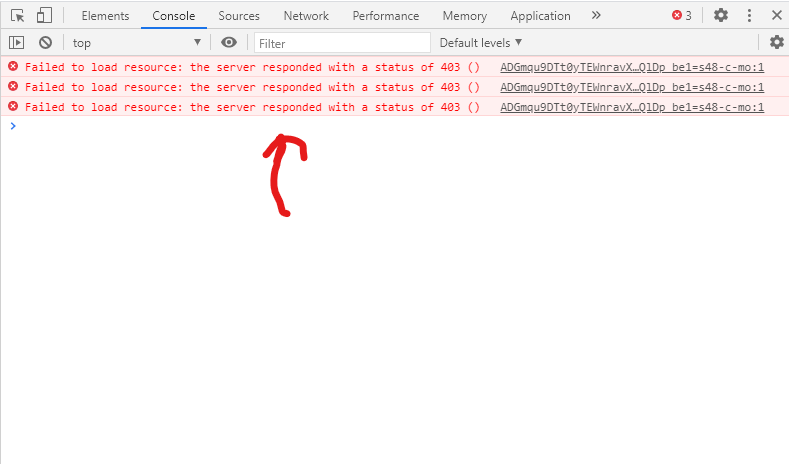
Good day. I am trying to plot timeseries with large data 2 billions of points and embed this plot into PyQt5 using QtWebEngineWidgets.
The Holoviews manual has the whole section on working with large data Working with large data using datashader. I am using the timeseries example from this chapter but when I run it the plot does not show. I tried python from VS Code and run python from Jupyter notebook. I am missing something…
Thanks.
The code snippet and list of installed packages are included
import datashader as ds
import numpy as np
import holoviews as hv
import pandas as pd
from holoviews import opts
from holoviews.operation.datashader import datashade, shade, dynspread, spread, rasterize
from holoviews.operation import decimate
hv.extension(‘bokeh’,‘matplotlib’)
def time_series(T = 1, N = 100, mu = 0.1, sigma = 0.1, S0 = 20):
“”“Parameterized noisy time series”""
dt = float(T)/N
t = np.linspace(0, T, N)
W = np.random.standard_normal(size = N)
W = np.cumsum(W)np.sqrt(dt) # standard brownian motion
X = (mu-0.5sigma**2)t + sigmaW
S = S0*np.exp(X) # geometric brownian motion
return S
points = [(0.1i, np.sin(0.1i)) for i in range(100)]
hv.Curve(points)
hv.HoloMap({i: hv.Curve([1, 2, 3-i], group=‘Group’, label=‘Label’) for i in range(3)}, ‘Value’)
dates = pd.date_range(start=“2014-01-01”, end=“2016-01-01”, freq=‘1D’) # or ‘1min’
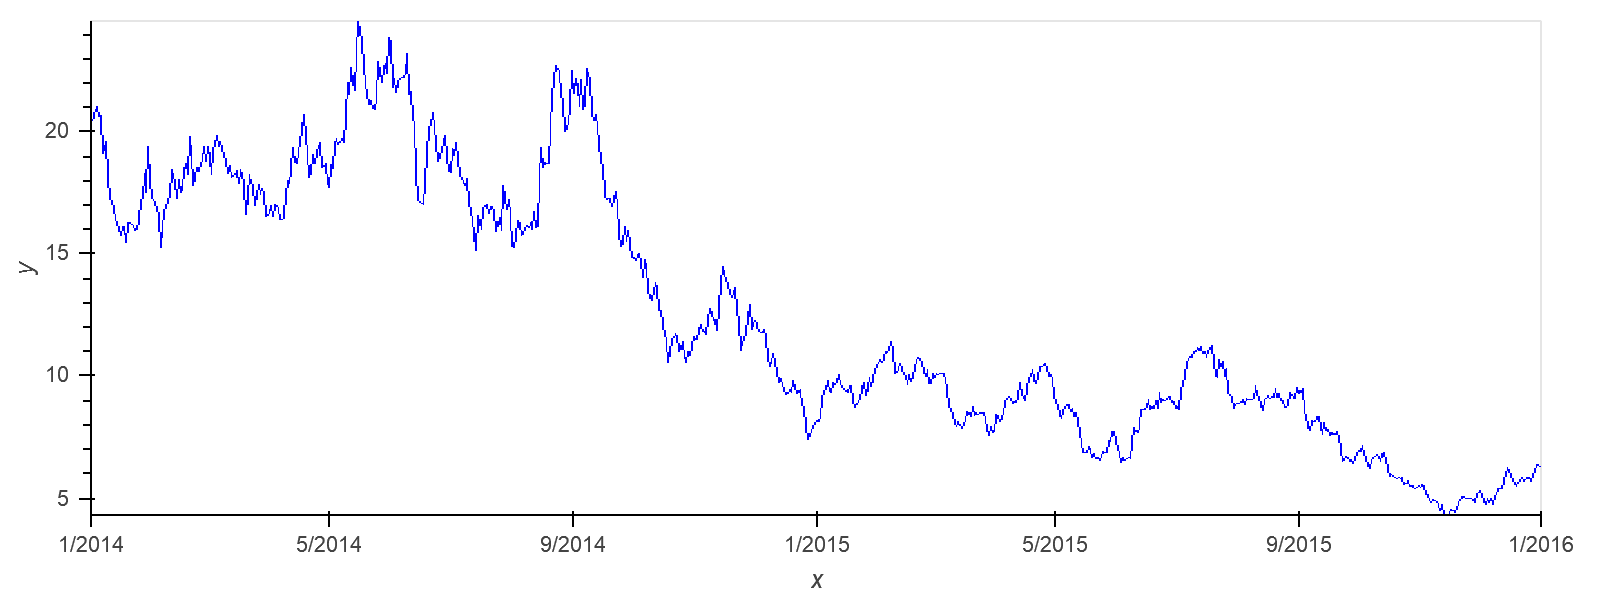
curve = hv.Curve((dates, time_series(N=len(dates), sigma = 1)))
rasterize(curve, width=800).opts(width=800, cmap=[‘blue’])
Package                   Version
------------------------- ---------
altgraph                  0.17
aplus                     0.11.0
argon2-cffi               20.1.0
astropy                   4.2
async-generator           1.10
attrs                     20.3.0
autopep8                  1.5.4
backcall                  0.2.0
bleach                    3.2.1
bokeh                     2.2.3
boto3                     1.16.30
botocore                  1.19.30
bqplot                    0.12.19
branca                    0.4.1
cachetools                4.1.1
certifi                   2020.12.5
cffi                      1.14.4
chardet                   3.0.4
click                     7.1.2
cloudpickle               1.6.0
colorama                  0.4.4
colorcet                  2.0.2
cycler                    0.10.0
dask                      2.30.0
datashader                0.11.1
datashape                 0.5.2
decorator                 4.4.2
defusedxml                0.6.0
distributed               2.30.1
entrypoints               0.3
fsspec                    0.8.4
future                    0.18.2
h5py                      3.1.0
HeapDict                  1.0.1
holoviews                 1.14.0
idna                      2.10
ipydatawidgets            4.1.0
ipykernel                 5.3.4
ipyleaflet                0.13.3
ipympl                    0.5.8
ipython                   7.19.0
ipython-genutils          0.2.0
ipyvolume                 0.5.2
ipyvue                    1.4.1
ipyvuetify                1.5.1
ipywebrtc                 0.5.0
ipywidgets                7.5.1
jedi                      0.17.2
Jinja2                    2.11.2
jmespath                  0.10.0
jsonschema                3.2.0
jupyter                   1.0.0
jupyter-client            6.1.7
jupyter-console           6.2.0
jupyter-core              4.7.0
jupyterlab-pygments       0.1.2
kiwisolver                1.3.1
llvmlite                  0.35.0
locket                    0.2.0
Markdown                  3.3.3
MarkupSafe                1.1.1
matplotlib                3.3.3
mistune                   0.8.4
msgpack                   1.0.1
multipledispatch          0.6.0
nbclient                  0.5.1
nbconvert                 6.0.7
nbformat                  5.0.8
nest-asyncio              1.4.3
notebook                  6.1.5
numba                     0.52.0
numexpr                   2.7.1
numpy                     1.19.4
packaging                 20.7
pandas                    1.2.0
pandocfilters             1.4.3
panel                     0.10.2
param                     1.10.0
parso                     0.7.1
partd                     1.1.0
pefile                    2019.4.18
pickleshare               0.7.5
Pillow                    8.0.1
pip                       21.0.1
progressbar2              3.53.1
prometheus-client         0.9.0
prompt-toolkit            3.0.8
psutil                    5.7.3
pyarrow                   2.0.0
pycodestyle               2.6.0
pycparser                 2.20
pyct                      0.4.6
pyerfa                    1.7.1.1
Pygments                  2.7.3
pyinstaller               4.2
pyinstaller-hooks-contrib 2020.10
PyOpenGL                  3.1.5
pyparsing                 2.4.7
PyQt5                     5.15.2
PyQt5-sip                 12.8.1
pyqtgraph                 0.11.0
PyQtWebEngine             5.15.2
pyrsistent                0.17.3
python-dateutil           2.8.1
python-utils              2.4.0
pythreejs                 2.2.1
pytz                      2020.4
pyviz-comms               0.7.6
pywin32                   300
pywin32-ctypes            0.2.0
pywinpty                  0.5.7
PyYAML                    5.3.1
pyzmq                     20.0.0
qtconsole                 5.0.1
QtPy                      1.9.0
requests                  2.25.0
s3fs                      0.2.2
s3transfer                0.3.3
scipy                     1.5.4
Send2Trash                1.5.0
setuptools                49.2.1
six                       1.15.0
sortedcontainers          2.3.0
tabulate                  0.8.7
tblib                     1.7.0
terminado                 0.9.1
testpath                  0.4.4
toml                      0.10.2
toolz                     0.11.1
tornado                   6.1
tqdm                      4.54.1
traitlets                 5.0.5
traittypes                0.2.1
typing-extensions         3.7.4.3
urllib3                   1.26.2
wcwidth                   0.2.5
webencodings              0.5.1
widgetsnbextension        3.5.1
xarray                    0.16.2
zict                      2.0.0