Hello! I am working as an intern for the USGS currently working on the Pangeo project and have a question. I have multiple sets of geographical data (each corresponding to a different location) and am trying to make a system which allows the user to toggle through different data sets. I also want the dashboard to display other information in a Markdown which changes based on the data that is selected. The data is currently graphed through a function I created. I discover that using the interact function I can easily make a widget which allows me to select the location I want, however the markdown does not update as well. How would I create a widget which controls both the interact function and the markdown at the same time? Or do I have to take a different approach to get the Markdown the change with the data?
1 Like
Could you provide a small code example? And if possible a screenshot or .gif video?
That makes it much easier to try to help.
Thanks.
Sorry here is my code.
import rasterio
import numpy as np
import xarray as xr
import hvplot.xarray
import holoviews as hv
import geoviews as gv
import rioxarray as rx
import os
import panel as pn
from holoviews import opts
hv.extension('bokeh', width=90)
pn.extension()

os.environ["AWS_REQUEST_PAYER"] = "requester"

maxheight = float(data.where(data>0).max())
minheight = float(data.where(data>0).min())

def options(where):
    data = xr.open_rasterio(where)
    data = data.where(data>0)[0,:,:]
    return gv.tile_sources.OSM *data.hvplot.quadmesh(rasterize=True,geo=True,colormap='viridis',project = True).opts(alpha=0.7)

greatest = pn.pane.Markdown('# Max height is '+ str(maxheight))
least = pn.pane.Markdown('# The Min height is '+ str(minheight))

pn.Row(
    pn.interact(options, where=places),
    greatest,
    least
    )
The out come looks like this
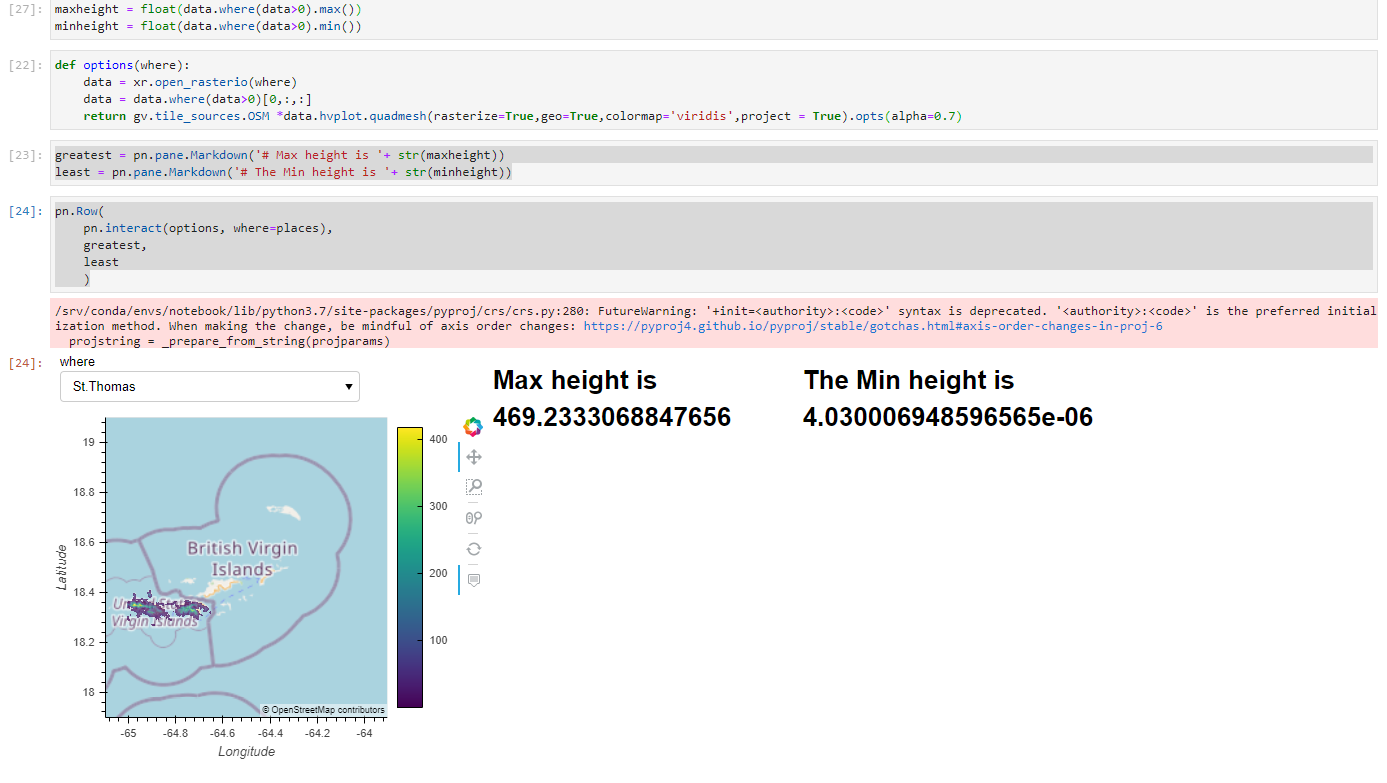
Right now I can toggle through locations using the widget but if I do the max height in the markdown does not update. What I want is a system where I can change the location (i.e use a different data set) and have the dashboard show the corresponding max and min height of that data. Is my approach completely off? How would I do this?
1 Like
I think you need to greatest.object and least.object in the options function.
You can try changing to something like
greatest = pn.pane.Markdown('# Max height is '+ str(maxheight))
least = pn.pane.Markdown('# The Min height is '+ str(minheight))

def options(where):
    data = xr.open_rasterio(where)
    data = data.where(data>0)[0,:,:]

    maxheight = float(data.where(data>0).max())
    minheight = float(data.where(data>0).min())
    greatest.object = '# Max height is '+ str(maxheight)
    least.object = '# The Min height is '+ str(minheight)

    return gv.tile_sources.OSM *data.hvplot.quadmesh(rasterize=True,geo=True,colormap='viridis',project = True).opts(alpha=0.7)
1 Like
Thank you so much! I’m very new to Panel so thank you for the help!
1 Like