Hi,
I wish to make a custom element BoxGraph, which combines graph and list of box.
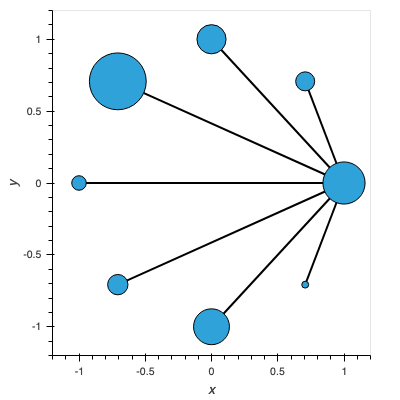
It is designed to highlight the patch wise relationship within 1 image.
Can you give me some tips on implementing this?
i just started reading the source, and what I gathered so far:
create BoxGraph under element, which inherits Graph
-should I inherits Rectangles as well, would it messes up the mro?
create BoxGraphPlot under plotting/boheh, which inherits GraphPlot
similarly, should I inherits RectanglesPlot as well?
register in bokeh/__init__.py associations
and mostly importantly, what are the minimum class functions I need to overwrite to make it work?
Wouldn’t it be sufficient to make the marker configurable on Graph itself configurable and then use something like .opts(node_size='size_dimension', node_marker='square')?
can you be more specific? i found the node_marker option in GraphPlot._nonvectorized_styles, how do I configure this?
if it’s not too much to ask, can you give me a concrete demo by modifying the following example?
It doesn’t seem to be currently supported, what I was saying was that instead of adding a new element you should just add support for this to the existing GraphPlot implementation. Currently you can do this:
or .opts(node_radius=hv.dim('size')*20) if you want the node size to stay consistent across zoom levels (i.e. set the size in screen space). Once we’ve added support for setting the marker you’ll be able to set it to square.
thanks, does it mean if I apply your PR to bokeh, I am able to make use of node_marker=‘square’ directly, or I still have to make my own square module?
Also, can you give a quick rundown of the workflow (in term of abstractions/callbacks) of how does plot/hover mechanism work using Holoviews, specifically what can/should be implemented on the Holoviews side, and what relies on bokeh completely.
ps: if I understand correctly, it’s very hard if not impossible to have custom callbacks (in python) for hover? the best workaround is https://github.com/holoviz/panel/issues/824?
We’ll need a small PR in HoloViews which adds node_marker as a style option otherwise it’ll work out of the box.
Also, can you give a quick rundown of the workflow (in term of abstractions/callbacks) of how does plot/hover mechanism work using Holoviews, specifically what can/should be implemented on the Holoviews side, and what relies on bokeh completely.
It doesn’t really interact with HoloViews in any way, HoloViews simply creates a default bokeh HoverTool with tooltips corresponding to the dimensions of the element. Bokeh will then display the appropriate hover information. Having a Python callback is indeed not really possible atm (and would probably be too slow). That said you could use a PointerXY to get the current hover coordinate and then use that information to display something in an adjacent panel object.