Hi
Does anyone know how to draw the line & labels across multiple indices?
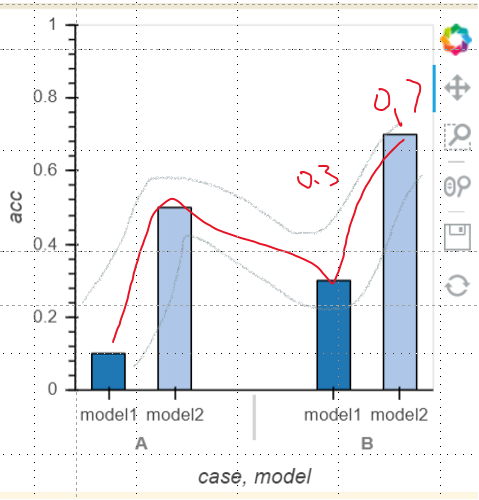
I can draw this bars
but I don’t know how to draw the lines and labels, since the indices are multiple columns
demo = {
    'ds': [3,3,3,3,4,4,4,4],
    'case': ['A', 'A', 'B', 'B', 'A', 'A', 'B', 'B'],
    'model': ['model1', 'model2', 'model1', 'model2', 'model1', 'model2', 'model1', 'model2'],
    'acc': [0.1, 0.5, 0.3, 0.7, 0.2, 0.4, 0.6, 0.8],
    'acc_pct': ['10.00%', '50.00%', '30.00%', '70.00%', '20.00%', '40.00%', '60.00%', '80.00%'],
    'acc_std': [0.01, 0.02, 0.03, 0.04, 0.02, 0.01, 0.04, 0.03]
    }

demo=pd.DataFrame(demo)
demo_plot = demo.query('ds==3').filter(items=['case', 'model', 'acc'])
print(demo_plot)

# ------ bars ------ #
bars = hv.Bars(demo_plot, ['case', 'model'], ['acc']).opts(opts.Bars(
    ylim=(0, 1),
    bar_width=0.5,
    # border=0,
    cmap='Category20',
    # show_frame=False,
    ))
bars