import holoviews as hv
hv.extension('bokeh')
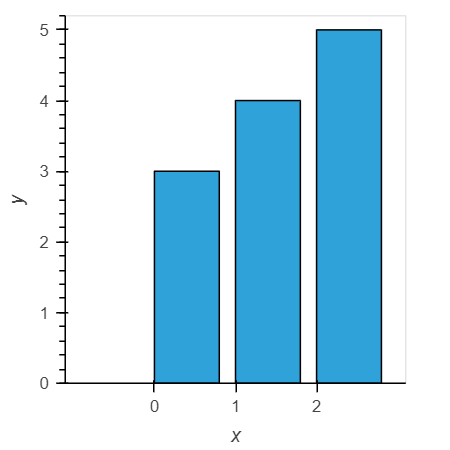
hv.Bars(([0, 1, 2], [3, 4, 5]))
Hi @ahuang11,
This is possible on the bokeh side with categorical offsets.
To make it work with HoloViews you can use a hook that makes it easy to access the ColumnDataSource of the bokeh object and smuggle the offsets after the fact.
Due to the resulting shift, I added some padding ; otherwise the far right bar is cropped. I don’t know how to have equal whitespace on the left and right side though.
If you want a continuous xaxis rather than a discrete one, maybe you could achieve the same result with a Histogram.
import holoviews as hv
hv.extension('bokeh')

data =dict(x=['0','1','2'], y=[3, 4, 5])

def hook(plot, element):
    offsets = 3*[0.4]
    plot.handles['cds'].data['x'] = list(zip(data['x'], offsets))
    plot.handles['x_range'].range_padding = 0.4

hv.Bars(data).opts(hooks=[hook])