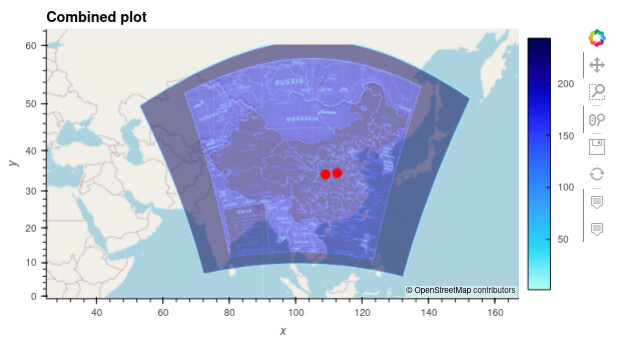
I have attached a notebook that generates the following plot. I chose to use hvplot which is based on Holoviews but have an easier interface to work with, in my opinion. hvplot uses Geoviews and Datashader behind the scene in this example. Some
4088_chinese-dynasty-dynamic-maps.ipynb (3.9 KB)
Or directly here:
import cartopy.crs as ccrs
import hvplot.pandas
import hvplot.xarray
import pandas as pd
import rioxarray as rxr
from bokeh.models import HoverTool


data = [
    ("TwelveVassals", None, None, None),
    (
        "WangMangperiod",
        "108.858333333 34.308333333",
        12118054.235234,
        4070279.1828400064,
    ),
    (
        "WangMangperiod",
        "108.858333333 34.308333333",
        12118054.235234,
        4070279.1828400064,
    ),
    ("Qindynasty", "108.716667 34.35,12102284.01118189", 4075895.856076398),
    ("Handynasty", "112.42447 34.65867", 12515034.753103662, 4117591.964602804),
]
df = pd.DataFrame(
    data,
    columns=["Period", "CapitalCoordinates", "CapitalMercatorX", "CapitalMercatorY"],
)


hover = HoverTool(
    tooltips=[
        ("", "@{Period}"),
        ("Capital Coordinates", "@{CapitalCoordinates}"),
    ]
)

xlim, ylim = (
    (7827151.696402039, 14636773.672271816),
    (7377090.428741338, 2093763.0722344585),
)

plot_points = df.hvplot.points(
    x="CapitalMercatorX",
    y="CapitalMercatorY",
    crs=ccrs.GOOGLE_MERCATOR,
    color="red",
    size=100,
    hover_cols="all",
    tools=[hover],
)


# Download file here: https://collections.leventhalmap.org/search/commonwealth:3f463903f
da = rxr.open_rasterio(
    "/home/shh/Downloads/commonwealth_3f463903f_image_georectified_primary.tif"
)
da = da.rio.reproject("EPSG:3857")


plot_map = da.sel(band=1).hvplot.image(
    x="x",
    y="y",
    tools=["hover"],
    crs=ccrs.GOOGLE_MERCATOR,
    rasterize=True,  # For speed up in plotting, uses Datashader
    tiles="OSM",
    alpha=0.5,
)
plot_map = plot_map.redim.nodata(value=0)  # Remove 0 from plot


(plot_map * plot_points).opts(title="Combined plot", active_tools=["wheel_zoom"])