Hello,
I read about the exciting development of “by” reduction operator in this commit. This is not supported as a valid argument to “aggregator” in the Holoviews.datashade yet. The main issue seems to be about the member “column” in Holoviews that becomes “columns” in Datashader. Is there any plan on integrating “by” into Holoviews.datashade, or any guide on how to try implementing this myself, or any other workaround?
What I want to do is as follows.
import holoviews as hv
import holoviews.operation.datashader as hd
import datashader as ds
import pandas as pd

df = pd.DataFrame({"x" : [...], "y" : [...], "cat" : [...], "weight" : [...]}) # actual values are omitted
df["cat"] = df["cat"].astype("category")
points = hv.Points(df, kdims=["x","y"], vdims=["cat","weight"])
hd.datashade(points, aggregator=ds.by('cat',ds.sum("weight")) )
The last one gives error " AttributeError: ‘by’ object has no attribute ‘column’. "
Thank you very much,
Rui
Great question, mind filing a HoloViews issue?
Issue filed here. Thank you in advance!
I confirm that the updated holoviews and datashader are working! Thank you.
I have a followup question though. I used the same test code as in my original post except for specifying the pd.DataFrame values, as pasted below.
import holoviews as hv
hv.notebook_extension('bokeh')
import holoviews.operation.datashader as hd
import datashader as ds
import pandas as pd
print(hd.ds_version)
df = pd.DataFrame({"x" : [0,1,0,1], "y" : [0,0,1,1], "cat" : [0,1,0,1], "weight" : [0,1,2,1]})
df["cat"] = df["cat"].astype("category")
points = hv.Points(df, kdims=["x","y"], vdims=["cat","weight"])
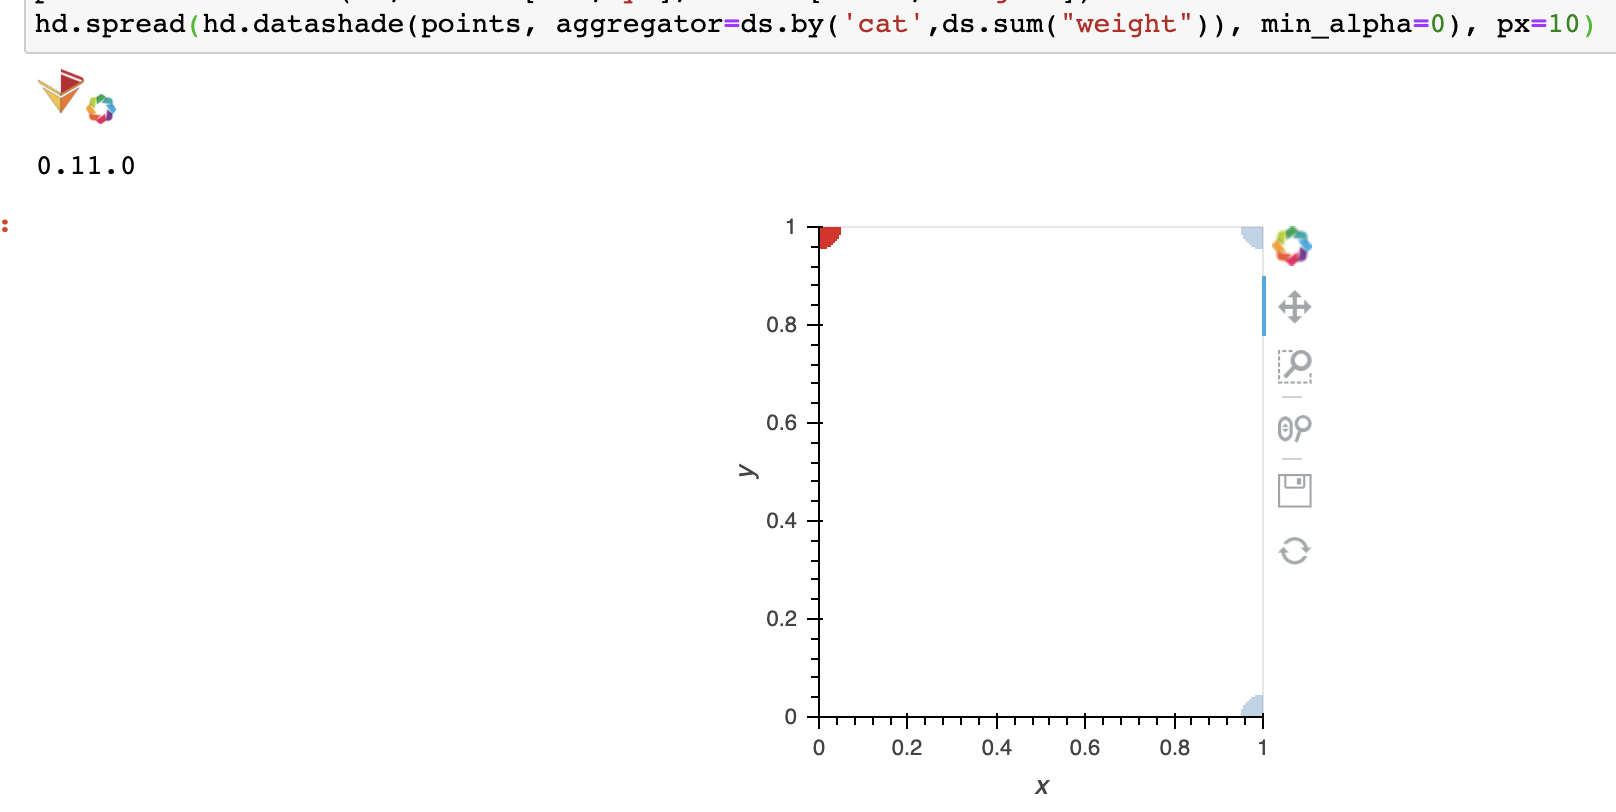
hd.dynspread(hd.datashade(points, aggregator=ds.by('cat',ds.sum("weight")) )).opts(
xlim=(-0.1,1.1), ylim=(-0.1,1.1)
)
Note that there is a data point with weight = 0. I expect that point to be effectively masked off when datashading. However, I got the following outcome,
, where the bottom left point is still visible. ( To reproduce exactly, you may need to pan the image a bit ) I also tested it without dynspread but got the same result. Can you point me to the reference or source code on how exactly datashader does aggregation? ( Sorry for being a little bit picky here, as I’m using HoloViews to do science research. )
Aggregation and colormapping are described in detail in getting_started/2_Pipeline.ipynb, which has been updated and expanded in Datashader’s 0.11 release to cover this topic (search for min_alpha). Here, Datashader’s default is to distinguish between zero-valued data and the absence of data, alerting you to the presence (and category, in this case) of data values even when they are at the low end of the data range. I.e., the low value (0 in this case) maps to min_alpha (defaulting to 40, which is faint but intended to be visible), and the high value maps to alpha (defaulting to 255, i.e. full opacity). In general, Datashader’s defaults are set deliberately to alert you to what’s in your dataset, making everything visible if it is possible to do so consistently (as it is in this case). If you want to hide the distinction between no data and zero-valued data, just set min_alpha=0:
Thanks! Exactly what I need!
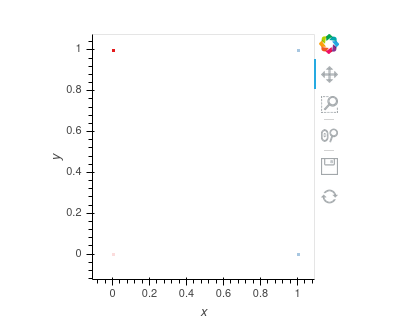
Oh sorry, another question. When I set min_alpha=0, and pan the image such that only the bottom left point is in the box, the point shows up again. Can you confirm? How can I fix these cases?
I just found out that using NaN as weight for data points you don’t want shown gives me the desired results! This is handy!
When you have a only a single point, it is both the minimum and the maximum value being displayed, so when you rely on auto-ranging then it’s ambiguous what should happen to it (should it map to min_alpha or alpha?) Again the default is to make things visible; if you want zero never to be visible then you can set the span explicitly to (0,max value), thereby disabling auto-ranging. I guess we could add an option for what should happen when there is only one value and that value is zero, but it’s probably not an option very many people would ever discover or realize that they need. So if NaN fits your needs, then you’re all set!
I think the problem is more about having one weight value, than having one data point. As a real world example, I’m using HoloViews to visualize astrophysical plasma, composed of positrons and electrons. The system is such that these two species will populate distinct regions eventually. So if I visualize only electrons by setting weight=0 for all positrons, by panning and zooming the image I may very well go into a region only populated by positrons, all of which have weight 0. So the described behavior will plot all positrons in this region all of a sudden, and without categorization they may be given the same color as electrons so they may be interpreted as electrons, which is against the intuition that weight 0 will mask off the species.
Before finding about the NaN, I was trying to solve this issue by filtering my data like this
df.loc[ df["species"] == "electron" ] # df is a pandas DataFrame
and then passing it to datashader. The problem is that by doing so the memory usage almost doubled and my jupyter notebook crashed. ( I had 16 GB of particle data, and 32 GB of memory ) So looks to me that there may be some unwanted copying happening.
Anyways, NaN nicely solves the problem. It is an effective way of filtering inside datashader. It may be worth mentioning this trick to other users, I think.
Ah, ok. Right; setting to NaN is a much more effective way to mask data than setting to zero, because even zero is data (which Datashader is duty bound to display  ); NaN is consistently interpreted as “no data”. If you can spot a good place to mention this technique in the docs, we’d welcome a PR!