Interactive Axis Limits

Is there another way to set the xlim, ylim of a plot interactively without using the pn.bind function? It seems that there should be a way using the redim method of DynamicMap but it is escaping me.
Below is a working example using pn.bind.

import numpy as np
import pandas as pd
from holoviews import opts
import holoviews as hv
import panel as pn

pn.extension()
hv.extension('bokeh')

opts.defaults(opts.Scatter(
    size=10,
    show_grid=True,
    framewise=True,
))

frames = [
    pd.DataFrame(arr, columns=['x', 'y'])
    for arr in np.random.randint(10, size=(10, 5, 2))
]
data_select = pn.widgets.Select(name='dataset',
                                options=frames,
                                value=frames[0])

xmin = pn.widgets.IntInput(name='xmin', value=0, step=1)
xmax = pn.widgets.IntInput(name='xmax', value=10, step=1)
ymin = pn.widgets.IntInput(name='ymin', value=0, step=1)
ymax = pn.widgets.IntInput(name='ymax', value=10, step=1)


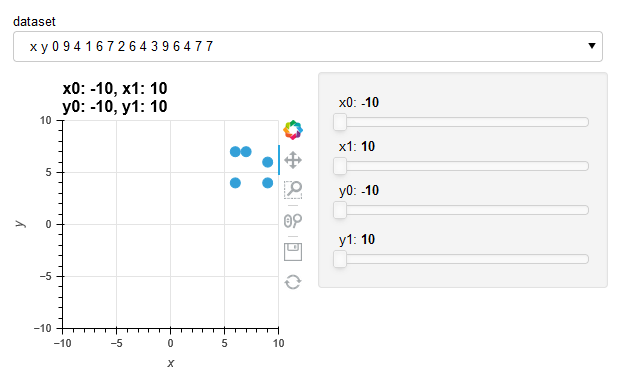
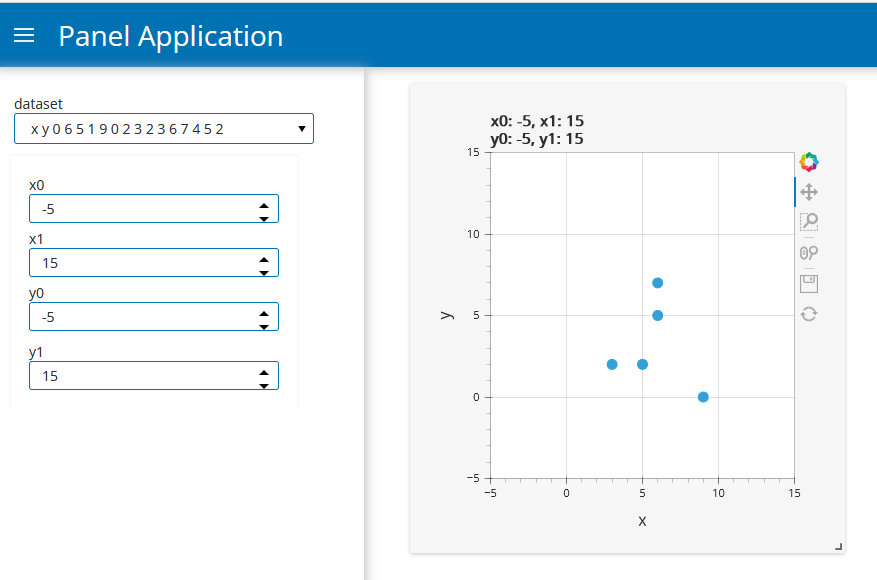
def update_scatter(data, x0, x1, y0, y1):
    return hv.Scatter(data).apply.opts(xlim=(x0, x1), ylim=(y0, y1))


scatter_dmap = hv.DynamicMap(
    pn.bind(
        update_scatter,
        data=data_select.param.value,
        x0=xmin.param.value,
        x1=xmax.param.value,
        y0=ymin.param.value,
        y1=ymax.param.value,
    ), )

pn.Row(pn.Column(data_select, scatter_dmap),
       pn.Column(xmin, xmax, ymin, ymax, width=100)).servable()

I figured out the redim method which uses built-in widgets.

import numpy as np
import pandas as pd
from holoviews import opts
import holoviews as hv
import panel as pn

pn.extension()
hv.extension('bokeh')

opts.defaults(opts.Scatter(size=10, show_grid=True, framewise=True))

frames = [
    pd.DataFrame(arr, columns=['x', 'y'])
    for arr in np.random.randint(10, size=(10, 5, 2))
]
data_select = pn.widgets.Select(name='dataset',
                                options=frames,
                                value=frames[0])


def update_scatter(value, x0, x1, y0, y1):
    return hv.Scatter(value).opts(xlim=(x0, x1), ylim=(y0, y1))


dmap = hv.DynamicMap(
    update_scatter,
    kdims=['x0', 'x1', 'y0', 'y1'],
    streams=[data_select.param.value],
).redim.range(x0=(-10, 10), x1=(10, 20), y0=(-10, 10), y1=(10, 20))

pn.Column(data_select, dmap).servable()

image

For posterity, here’s the code with customized DynamicMap widgets moved into the sidebar of a template.

import numpy as np
import pandas as pd
from holoviews import opts
import holoviews as hv
import panel as pn

import numpy as np
import pandas as pd
from holoviews import opts
import holoviews as hv
import panel as pn

pn.extension()
hv.extension('bokeh')

opts.defaults(opts.Scatter(size=10, show_grid=True, framewise=True))

frames = [
    pd.DataFrame(arr, columns=['x', 'y'])
    for arr in np.random.randint(10, size=(10, 5, 2))
]
data_select = pn.widgets.Select(name='dataset',
                                options=frames,
                                value=frames[0])


def update_scatter(value, x0, x1, y0, y1):
    return hv.Scatter(value).opts(xlim=(x0, x1), ylim=(y0, y1))


dmap = hv.DynamicMap(
    update_scatter,
    kdims=['x0', 'x1', 'y0', 'y1'],
    streams=[data_select.param.value],
).redim.range(x0=(-100, 100),
              x1=(-100, 100),
              y0=(-100, 100),
              y1=(-100, 100)).opts(framewise=True, responsive=True)

hvpane = pn.panel(dmap,
                  widgets={
                      'x0':
                      pn.widgets.IntInput(name='x0',
                                          value=-5,
                                          start=-100,
                                          end=100,
                                          step=10),
                      'x1':
                      pn.widgets.IntInput(name='x1',
                                          value=15,
                                          start=-100,
                                          end=100,
                                          step=10),
                      'y0':
                      pn.widgets.IntInput(name='y0',
                                          value=-5,
                                          start=-100,
                                          end=100,
                                          step=10),
                      'y1':
                      pn.widgets.IntInput(name='y1',
                                          value=15,
                                          start=-100,
                                          end=100,
                                          step=10),
                  },
                  sizing_mode='stretch_both')

hvmap = hvpane[0]
widgets = hvpane[1]

template = pn.template.FastGridTemplate()
template.sidebar[:] = [data_select, widgets]
template.main[:3, :3] = pn.Row(hvmap, sizing_mode='stretch_both')
template.servable()