Hi,
sure!
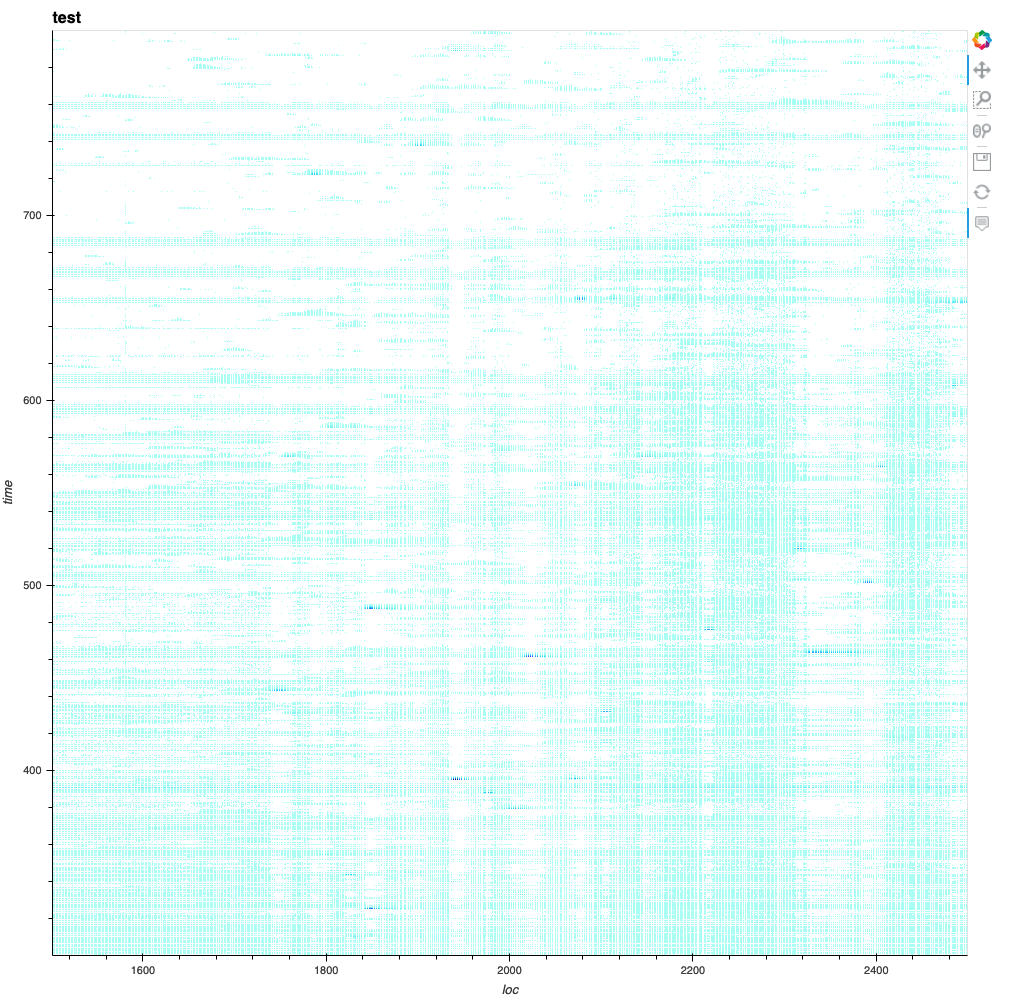
I actually just want the plot to look exactly like the one I am producing now and attached to my previous post.
So far I have:
import datashader
from holoviews.plotting.util import process_cmap
import numpy as np
import pandas as pd
import holoviews as hv
import holoviews.operation.datashader as hd
from holoviews import dim
hv.extension('bokeh')


data2 = [
    [10.0,np.array([5.0,7.0,9.0],dtype='f'),np.array([10.0,200.0,30.0],dtype='f')],
    [15.0,np.array([5.2,5.6,9.7],dtype='f'),np.array([100.0,20.0,30.0],dtype='f')],
    [25.0,np.array([1.1,7.2,9.3],dtype='f'),np.array([110.0,20.0,33.3],dtype='f')],
    [110.0,np.array([5.0,7.0,9.0],dtype='f'),np.array([10.0,200.0,30.0],dtype='f')],
    [115.0,np.array([5.2,5.6,9.7],dtype='f'),np.array([100.0,20.0,30.0],dtype='f')],
    [125.0,np.array([1.1,7.2,9.3],dtype='f'),np.array([110.0,20.0,33.3],dtype='f')],
    [210.0,np.array([5.0,7.0,9.0],dtype='f'),np.array([10.0,200.0,30.0],dtype='f')],
    [215.0,np.array([5.2,5.6,9.7],dtype='f'),np.array([100.0,20.0,30.0],dtype='f')],
    [225.0,np.array([1.1,7.2,9.3],dtype='f'),np.array([110.0,20.0,33.3],dtype='f')],
]

flatdata = np.fromiter(((series[0],point[0],point[1]) for series in data2 for point in zip(series[1],series[2])), count=27,dtype=[('time', 'f'), ('loc', 'f'), ('inty', 'f')])
df = pd.DataFrame(data=flatdata, columns=['time','loc','inty'])

points = hv.Points(df, kdims=['time', 'loc'], vdims=['inty']).opts(
    fontsize={'title': 16, 'labels': 14, 'xticks': 6, 'yticks': 12},
    color=np.log(dim('inty')),
    colorbar=True,
    cmap='Magma',
    width=1000,
    height=1000,
    tools=['hover'])

raster = hd.rasterize(points,cmap=process_cmap("blues", provider="bokeh"),aggregator=datashader.sum('inty'),cnorm='log',alpha=50, min_alpha=10).opts(
    tools=['hover']).opts(
    plot = dict(
        width=1000,
        height=1000)
)

hv.renderer('bokeh')
hd.dynspread(raster)
The only thing I want to get rid of, is the “flatdata” line, since it is rather wasteful with millions of datapoints. I want to directly plot from the discretized data.
Thanks!