import holoviews as hv
import panel as pn
import pandas as pd

pn.extension("tabulator")
hv.extension("bokeh")

df = pd.DataFrame({"x": [0, 1, 2], "y": [3, 4, 5]})

table = pn.widgets.Tabulator(value=df, selection=df.index.tolist())

def plot(selection):
    sub_df = df.iloc[selection]
    return hv.Scatter(sub_df, "x", "y").opts(size=25)

pn.Row(table, hv.DynamicMap(plot, streams=[table.param.selection]))
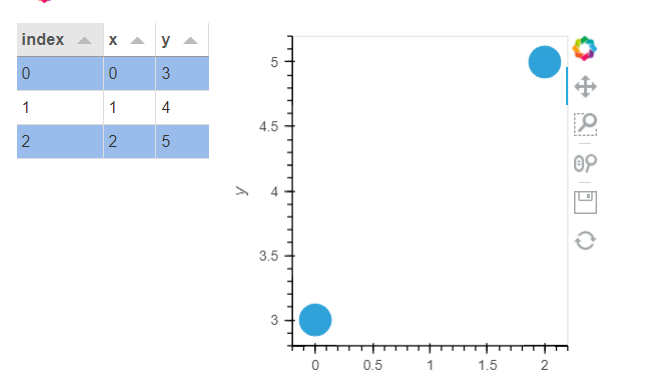
**Replace Scatter with Curve (but in this case, because there’s a break in the points, it shows nothing with Curve if you select only one point so I demonstrated with Scatter)