Success! I stumbled across this related one: Dynamically fetch other column value from selection1D stream
…and I think this revised section works:
point_size_slider = pn.widgets.IntSlider(name="Point Size",start=3,end=12,value=7)
@pn.depends(size=point_size_slider.param.value)
def base_points(size):
return gv.Points(gv_table,kdims=['Longitude','Latitude'],vdims=['City','Country']).opts(size=size,tools=['lasso_select'],nonselection_alpha=0.2)
test = hv.DynamicMap(base_points)
sel = streams.Selection1D(source=test)
def get_countries(table, index):
temp_ds = hv.Dataset(table.iloc[index]['Country'], 'Country')
#lst = (temp_ds[()].data['Country'].values[:])
return hv.Table(temp_ds[()].data['Country'])
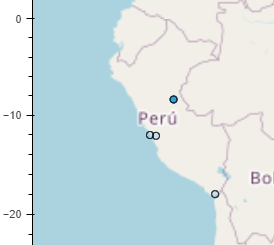
def highlight_missed(table, index):
'''
Add another layer of points (empty black circle outlines) for the selected points; but expand visible points to all that share country label
'''
if len(index)>0:
selected_countries = list(hv.Dataset(table.iloc[index]['Country'], 'Country')[()].data['Country'])
return gv.Points(table.select(Country=selected_countries),kdims=['Longitude','Latitude'],vdims=['City','Country']).opts(size=7,nonselection_alpha=1.0,fill_color=None,line_width=1,line_color='black')
else:
return gv.Points(table,kdims=['Longitude','Latitude'],vdims=['City','Country']).opts(size=7,fill_color=None,line_width=1,line_color='black')
test2 = gv_table.apply(highlight_missed, streams=[sel])
id_dmap = gv_table.apply(get_countries, streams=[sel])
plot = tiles*test*test2
layout = pn.Row(pn.Column(point_size_slider,plot.opts(width=600,height=600)),id_dmap)
layout
(also added the hv.table to help check things while troubleshooting)