I am getting some strange issues when trying to use the pn.pipeline.Pipeline.
The app I am trying to make have several steps, and the first one is loading the data into memory with Dataloader from dataloading.py, and the second step involves viewing the data via holoviews interactively (Preprocess from preprocess.py).
I am hooking up the two steps with the following code:
import panel as pn
pn.extension('katex', nthreads=0, notifications=True)
from dataloading import DataLoader
from preprocess import Preprocess

pn_app = pn.pipeline.Pipeline(
    stages=[
        ("Load Data", DataLoader),
        ("Preprocess", Preprocess),
    ],
    debug=True,
)
When viewing the pipeline within notebook (same issue happens with panel serve, but I can debug it within the notebook), the first step, dataloading went fine without anyissue.
But after clicking on next to move to the next stage, the display got all messed-up as shown in the first screenshot
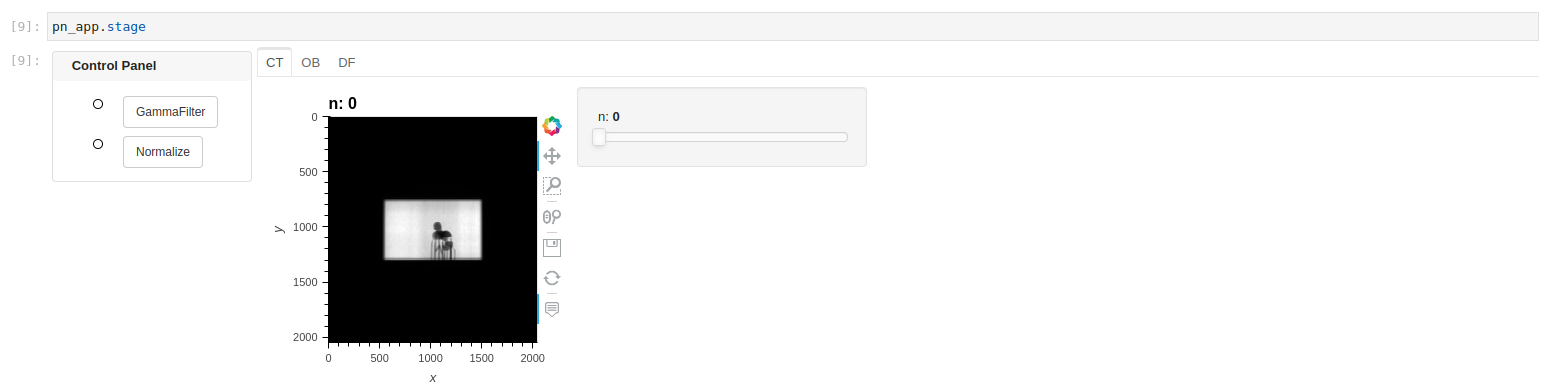
However, if I manually type pn_app.stage to show the current stage, the current holoview image viewer shows up (all widgets function as expected within this view).
I am not sure if this is a bug, or perhaps I am missing some critical configuration step to make holoview viewer initialized properly after clicking on next.
It would be great if someone can help me figure out what is going on here.
A quick followup, when switching the backend from bokeh to plotly with hv.extension("plotly"), the pipeline displaying problem is gone.
So perhaps this is a bokeh integration problem?
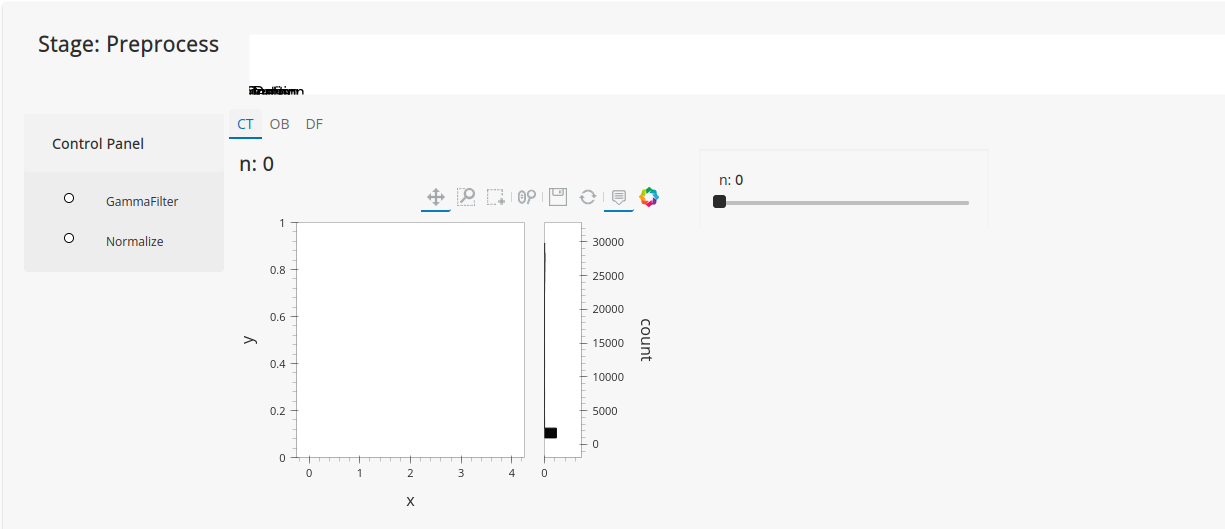
When running inside the browser via panel serve, I noticed that the data is shifted upwards by 2k, which is the also the image size (see screenshot below).
It seems like Bokeh is modifying the hv.Dataset dimension even if there is no change in the data source.
Another strange thing noticed is that clicking the reset range button will force reset the data range to [0, 1] (see screenshot below)
Right now I can run the code. because I don’t have access to the package imars3dv2. I think it should be possible to simplify the example by removing it from a pipeline and generating random data.
Actually I just found a solution to my problem. The culprit is the network plot from pipeline, which has its axes linked with my other image viewers. If I do the following
Then I no longer have any image displaying issues.
I think the long term solution should be making Pipeline.network.linked_axes=False the default option, especially when using “bokeh” as the backend.