The lower left plot in a Holoviews (1.14.0) GridMatrix seems to be vertically aligned to the end. Whereas the other bottom plots don’t. This becomes clear when tick values with different lengths are rotated.
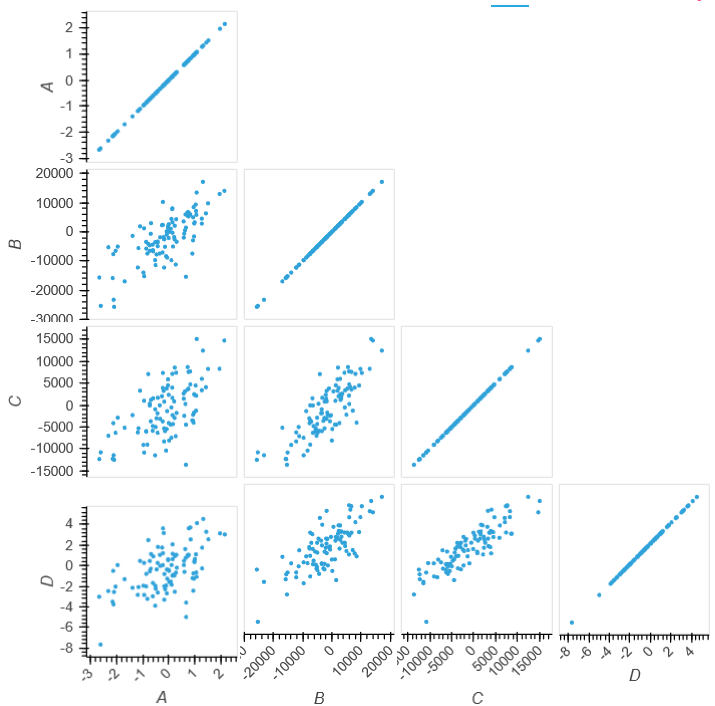
I’m guessing the individual plot alignments are hardcoded in
GridMatrix.I’ve played around with the
align option, but it controls both vertical and horizontal alignments, and doens’t respond as expected when set on the individual scatter plots.
Any other suggestions for modifying my code to handle this?
xrotation=45

n = 4
columns=[chr(65+i).upper() for i in range(n)]
df = pd.DataFrame(columns=columns,
                  data=np.random.randn(100,n).cumsum(axis=1)*[*[1]*int(n/2-1),*[x for x in np.random.randint(1e3,1e4,int(n/2))],1])

grid=hv.GridMatrix(sort=False)  # ensure lower triangular shape
x_columns = columns
y_columns = columns
for i,x in enumerate(x_columns):
    y_column_selection = y_columns[i:][::-1]
    for y in y_column_selection:
        grid[x,y] = hv.Points(df,kdims=[x,y])
grid.opts(hv.opts.Points(xrotation=xrotation))
grid
Kind regards