Hi there,
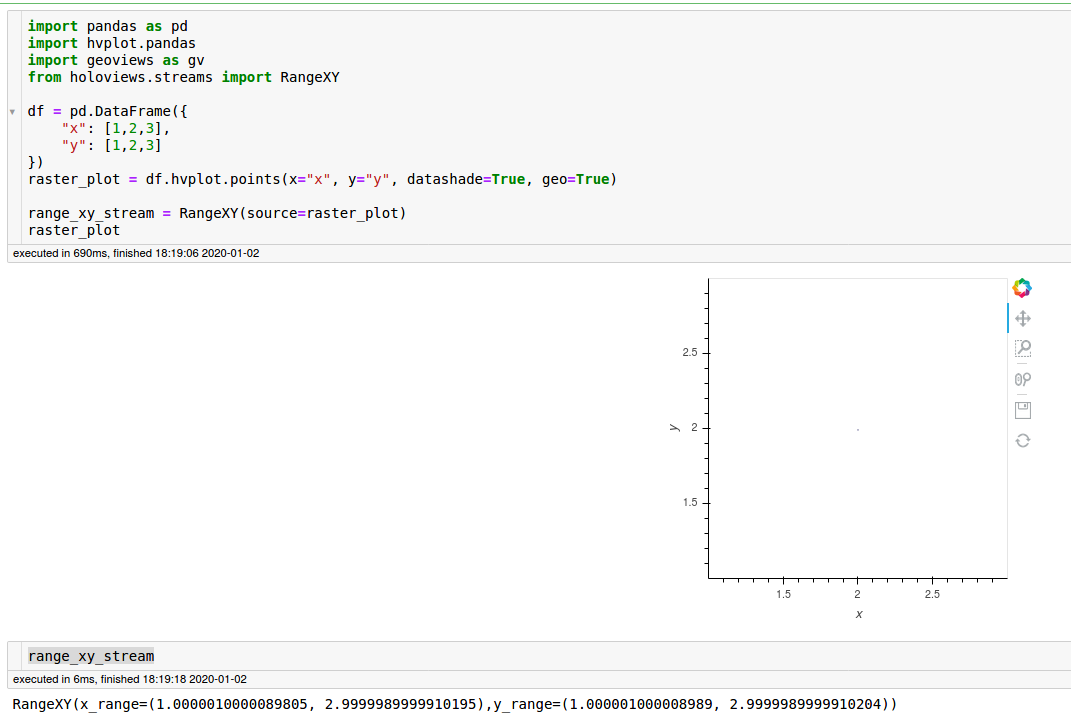
I’m trying to get the RangeXY from a datashaded set of points. This works fine (i.e. I get a range values out):
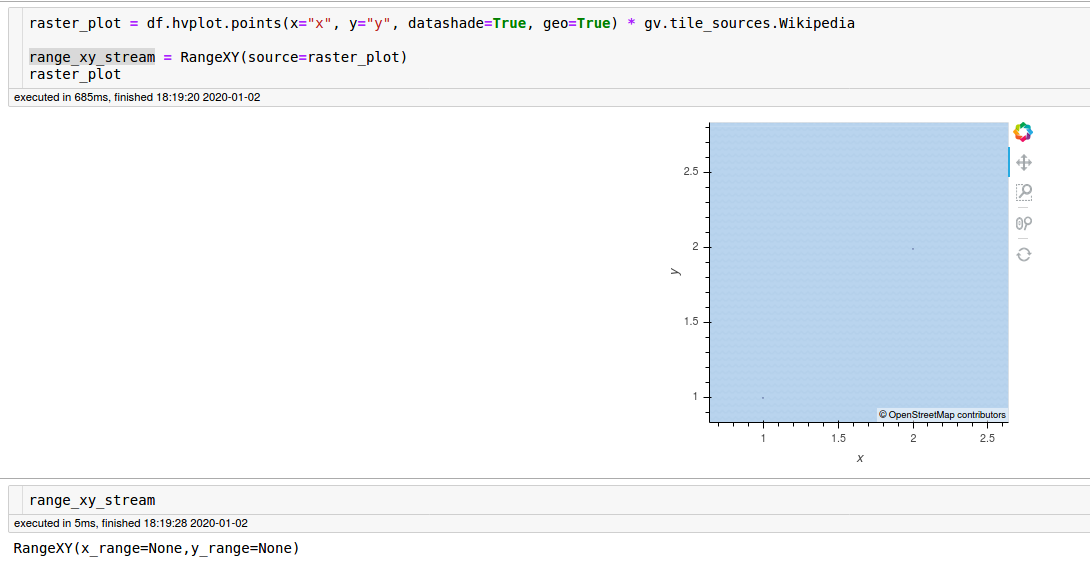
However when I try to overlay a GeoViews tile source, the RangeXY stream returns no values:
Not sure if this is a bug, but thought I’d mention here in case I’m doing something wrong. Thanks!
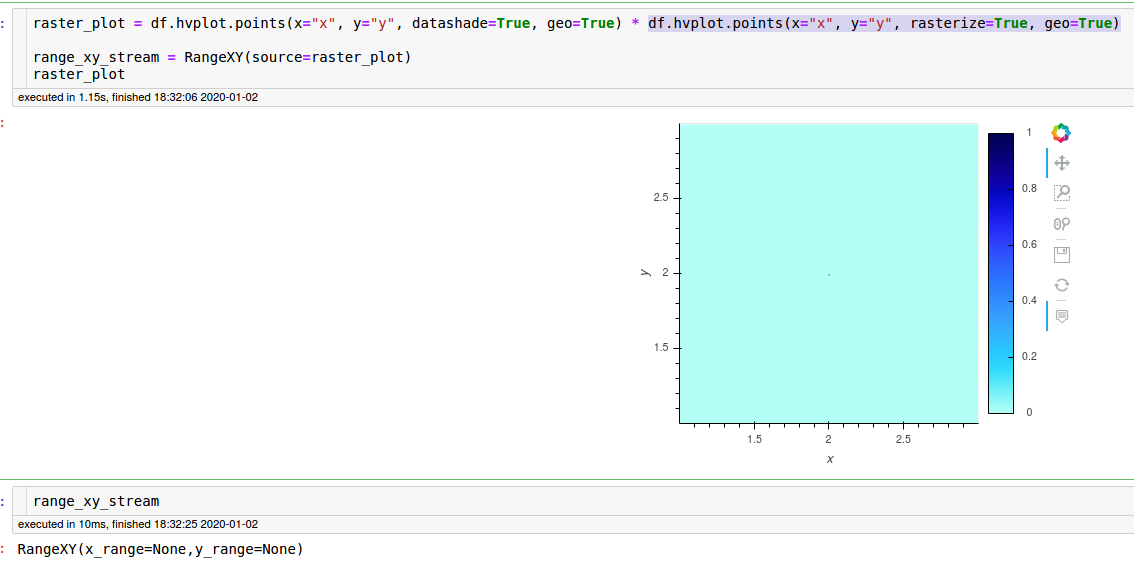
This doesn’t appear to be particular to GeoViews:
Here is the code as text if useful:
import pandas as pd
import hvplot.pandas
import geoviews as gv
from holoviews.streams import RangeXY

df = pd.DataFrame({
    "x": [1,2,3],
    "y": [1,2,3]
})
raster_plot = df.hvplot.points(x="x", y="y", datashade=True, geo=True)

range_xy_stream = RangeXY(source=raster_plot)
raster_plot
and
raster_plot = df.hvplot.points(x="x", y="y", datashade=True, geo=True) * gv.tile_sources.Wikipedia
and
raster_plot = df.hvplot.points(x="x", y="y", datashade=True, geo=True) * df.hvplot.points(x="x", y="y", rasterize=True, geo=True)
So it is indeed currently not possible to attach a RangeXY stream to an overlay. For now though, can’t you just get a handle on the plot, attach the stream and then overlay the tile source?
2 Likes
Thanks very much for the advice @philippjfr, great idea! This works beautifully:
raster_plot = df.hvplot.points(x="x", y="y", datashade=True, geo=True)

range_xy_stream = RangeXY(source=raster_plot)
raster_plot * gv.tile_sources.Wikipedia
1 Like
Any ETA on when this will be fixed?
Edit:
I found another way to access the visible range:
data = p1[1].object[()].Image.I.data
dates = data.date.values
prices= data.price.values
x_range = (dates[0],dates[-1])
y_range = (prices[0],prices[-1])
In my use-case I need to re-plot the entire dataset, but also wanted to keep the previous view-range.