Ah, I found the issue on GitHub; I’ve wanted this since 2020 (or probably earlier), and with Panel, I think it’s doable.
import xarray as xr
import hvplot.xarray
import panel as pn
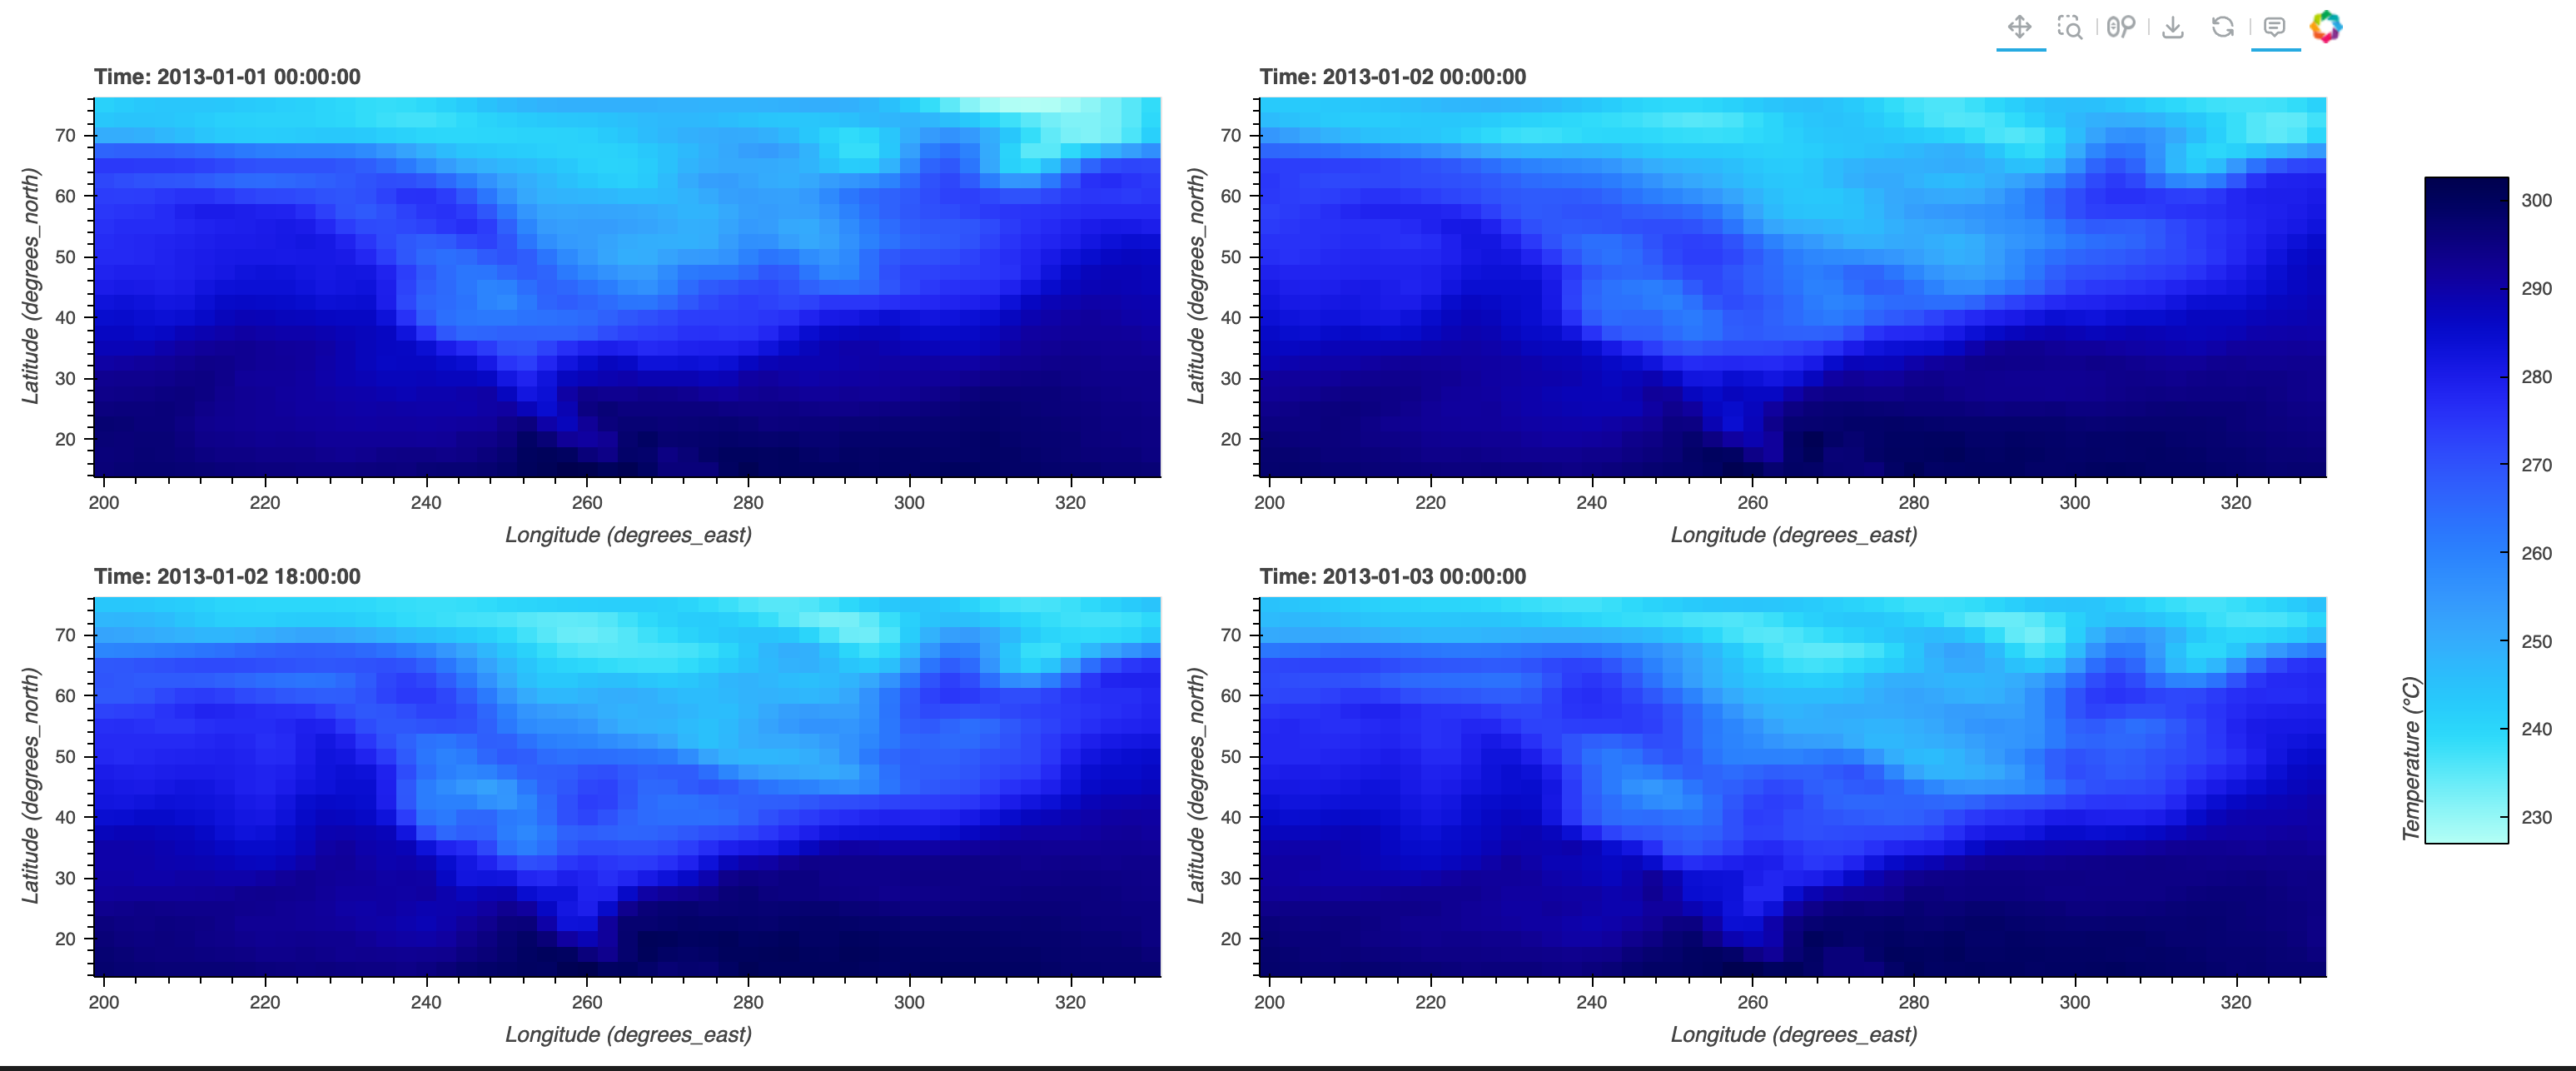
ds = xr.tutorial.open_dataset('air_temperature').isel(time=[0, 4, 7, 8])
l = ds.hvplot('lon', 'lat', colorbar=False).layout()
plots = l.cols(2)
shared_colorbar = l.values()[0].clone().opts(
colorbar=True,
frame_width=0,
frame_height=500,
show_frame=False,
shared_axes=False,
xaxis=None,
yaxis=None,
toolbar=None,
colorbar_opts={"width": 50, "height": 400, "title": "Temperature (°C)"},
)
# colorbar_opts: background_fill_alpha, background_fill_color, bar_line_alpha, bar_line_cap, bar_line_color, bar_line_dash, bar_line_dash_offset, bar_line_join, bar_line_width, border_line_alpha, border_line_cap, border_line_color, border_line_dash, border_line_dash_offset, border_line_join, border_line_width, color_mapper, context_menu, coordinates, display_high, display_low, elements, formatter, group, height, js_event_callbacks, js_property_callbacks, label_standoff, level, location, major_label_overrides, major_label_policy, major_label_text_align, major_label_text_alpha, major_label_text_baseline, major_label_text_color, major_label_text_font, major_label_text_font_size, major_label_text_font_style, major_label_text_line_height, major_label_text_outline_color, major_tick_in, major_tick_line_alpha, major_tick_line_cap, major_tick_line_color, major_tick_line_dash, major_tick_line_dash_offset, major_tick_line_join, major_tick_line_width, major_tick_out, margin, minor_tick_in, minor_tick_line_alpha, minor_tick_line_cap, minor_tick_line_color, minor_tick_line_dash, minor_tick_line_dash_offset, minor_tick_line_join, minor_tick_line_width, minor_tick_out, name, orientation, padding, propagate_hover, renderers, scale_alpha, subscribed_events, syncable, tags, ticker, title, title_standoff, title_text_align, title_text_alpha, title_text_baseline, title_text_color, title_text_font, title_text_font_size, title_text_font_style, title_text_line_height, title_text_outline_color, visible, width, x_range_name or y_range_name
pn.Row(plots, shared_colorbar, align="center")