Hi All, I am new to Holoviews and have started exploring it’s capabilities which seem to be more than the other lone plots… thus, I wanted to continue working and exploring the EDA through Holoviews. And, I am stuck -
I have a problem statement I am working on… its actually on classic Titanic Dataset… I have kdims as “Fare” column values and vdims as “Survived”… I am trying to plot a Bar graph with the help of Slider functionality that changes the length of the “Fare” bar by changing the Slider value at runtime. Although, I was able to partially achieve it however, I prefer to have a custom slider that has range between certain integer values for Bar graphs. Is it possible?
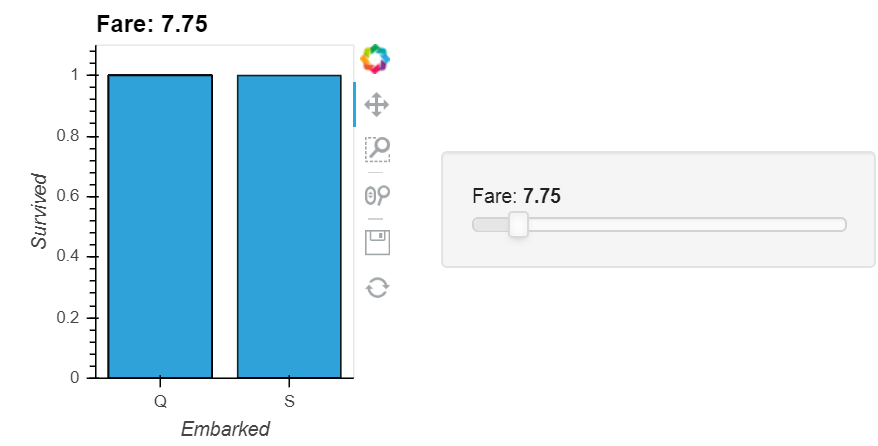
As shown in above figure, the Fare (slider value) is 7.75. The requirement is to have slider values in integers steps that is, 0 -10, 20, 30, 40 and so on, which changes the Bar graph at runtime.