Hi all,
I’m making a network visualization app using Panel and I’m trying to come up with a workaround for the fact that the colorbar option for holoviews.Graph is currently nonfunctional (as per this issue). Obviously there are many parameters that could be color mapped using opts.Graph, but for the moment I’m just interested in making two colorbars to represent the node_color and edge_color mappings. In my case, these colorbars need to update with the graph.
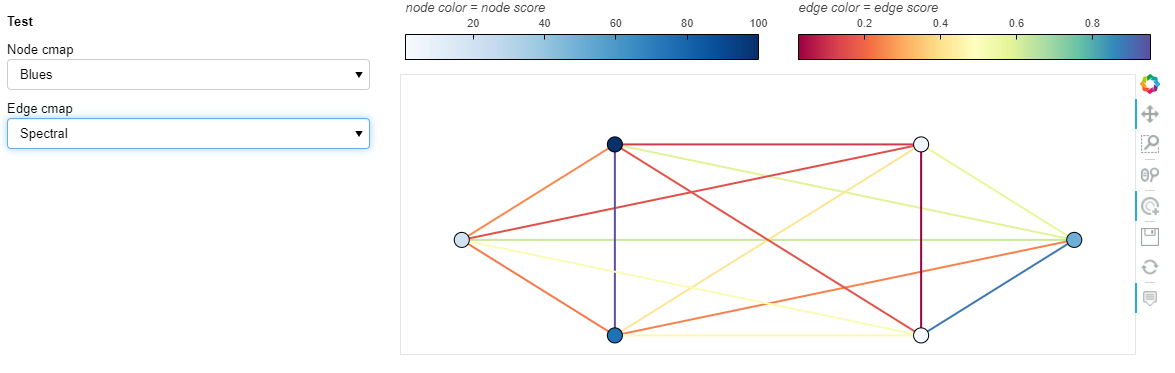
My current solution has been to make “invisible” heatmaps (by setting alpha=0) using the desired cmap and clim for each colorbar. I’ve then plotted these above my network in a separate Holoviews pane. However, I’m struggling to figure out how to get these to scale nicely with my network in a responsive layout–I’m always left with some amount of white space or the colorbar is cutoff.
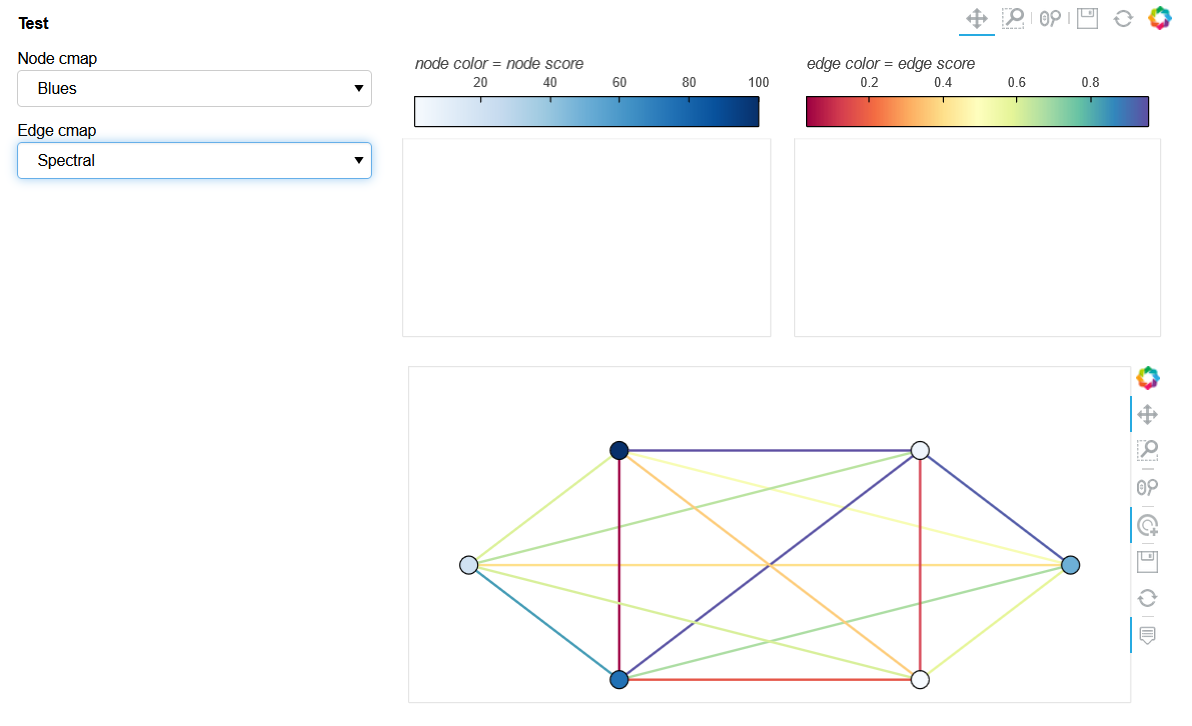
I’ve tried setting xlim and ylim to (0, 0) and different aspect options, but I can’t get the heatmap plot area to completely compress. I think it’s probably also possible to accomplish this using an overlay, but I haven’t been able to figure out how to plot colorbars side-by-side using this approach.
Ultimately, I think my questions are:
- Is there a better way to add two colorbars side-by-side on top of a graph
- Is there a way to “remove” a plot area, but keep the colorbar
- Is there a way to make the colorbar responsive in both its height and width?
See the code below for my current attempt. Thanks in advance for any help with this!
import pandas as pd
import numpy as np
import itertools
import matplotlib
import holoviews as hv
from holoviews import opts, dim
import networkx as nx
import panel as pn
import param

hv.extension('bokeh')
pn.extension(sizing_mode='stretch_width')

def scale_between(mn, mx, arr):
    ## scale an array linearly between two values

    return (mx-mn)*((arr-arr.min())/(arr.max()-arr.min()))+mn

def make_colorbar(cmap, clim, orientation = 'horizontal', position = 'top', colorbar_opts = {}, **kwargs):
    ## create an invisible hv.Heatmap plot just to use its colorbar

    hm = hv.HeatMap([(0, 0, clim[0]), (0, 1, clim[1])])

    return hm.opts(colorbar=True,
                   colorbar_opts=colorbar_opts,
                   clim=clim,
                   alpha=0,
                   colorbar_position=position,
                   cmap=cmap,
                   **kwargs)

class Test(param.Parameterized):
    nodes = param.DataFrame(precedence = -1)
    edges = param.DataFrame(precedence = -1)

    node_color = param.String(precedence=-1)
    edge_color = param.String(precedence=-1)

    node_cmap = param.Selector(objects = ['Spectral', 'Greys', 'Blues'], default = 'Blues')
    edge_cmap = param.Selector(objects = ['Spectral', 'Greys', 'Blues'], default = 'Blues')

    def __init__(self, **params):
        super(Test, self).__init__(**params)

        self.network_pane = pn.pane.HoloViews()
        self.legend_pane = pn.pane.HoloViews()

        self.plot_network()
        self.plot_colorbars()

    @param.depends('node_cmap', 'edge_cmap', watch=True)
    def plot_network(self):

        # create a networkx graph from self.nodes and self.edges, using columns as attributes
        g = nx.Graph()
        g.add_nodes_from(self.nodes.apply(lambda x: (x.name, x.to_dict()), axis=1).values.tolist())
        g.add_edges_from(self.edges.apply(lambda x: (x['source'], x['target'], x.to_dict()), axis=1).values.tolist())

        # make an hv.Graph from the networkx graph
        graph = hv.Graph.from_networkx(g, nx.circular_layout)
        graph_opts = opts.Graph(
            xaxis = None,
            yaxis = None,
            node_color = scale_between(0, 256, hv.dim(self.node_color)), # scale between 0 and 256 so that colors aren't clipped
            edge_color = scale_between(0, 256, hv.dim(self.edge_color)), # scale between 0 and 256 so that colors aren't clipped
            node_cmap = getattr(matplotlib.cm, self.node_cmap),
            edge_cmap = getattr(matplotlib.cm, self.edge_cmap),
        )
        self.graph = graph

        # set the network_pane object as the graph w/ appropriate opts
        self.network_pane.object = graph.opts(graph_opts)

    @param.depends('node_cmap', 'edge_cmap', watch=True)
    def plot_colorbars(self):

        graph_opts = {
            'xaxis': None,
            'yaxis': None,
            'responsive': True,
            'show_frame': True,
        }

        node_clim = (self.nodes[self.node_color].min(), self.nodes[self.node_color].max())
        node_cbar = make_colorbar(getattr(matplotlib.cm, self.node_cmap), node_clim, colorbar_opts = {'title': 'node color = {}'.format(self.node_color)}, **graph_opts)

        edge_clim = (self.edges[self.edge_color].min(), self.edges[self.edge_color].max())
        edge_cbar = make_colorbar(getattr(matplotlib.cm, self.edge_cmap), edge_clim, colorbar_opts = {'title': 'edge color = {}'.format(self.edge_color)}, **graph_opts)

        # set the legend_pane object as the Layout of node_bar + edge_cbar
        self.legend_pane.object = node_cbar+edge_cbar


test_nodes = pd.DataFrame([[50.],
                           [5.],
                           [100.],
                           [20.],
                           [75.],
                           [1.]], columns = ['node score'])

e = np.array(list(itertools.combinations(test_nodes.index, 2)))
test_edges = pd.DataFrame(np.vstack([e.T, np.random.uniform(0, 1, len(e))]).T, columns = ['source', 'target', 'edge score'])

test = Test(nodes=test_nodes, edges=test_edges, node_color='node score', edge_color='edge score')
window = pn.GridSpec(ncols=3)
window[:, 0] = pn.Param(test)
window[:, 1:] = pn.Column(test.legend_pane, test.network_pane)
window