Hey there!
I am new to HoloViews but the ecosystem seems very useful. I am trying to couple various different interactions together but it has been a difficult affair.
I have a data cube of hyperspectral images as an xarray that I want to plot as a HeatMap, using a DynamicMap to select the specific wavelength slice to display. Additionally, I want to show a Curve as a DynamicMap of the average spectrum of all selected data points.
I also have embeddings, which are basically 2 values per pixel of the data cube that I want to plot against each other using a Points plot. This has to be datashaded as there are way too many points to plot normally.
Now, I would like to use the link_selections functionality to allow selections in the HeatMap and embeddings Points plot to sync selections. I am using an xr.Dataset to store the data and would like to use an index coordinate to sync the selections easily, which I included as a non-dimensional coordinate in the xarray. I also tried linking the embeddings to my x and y coordinates but it seems that HoloViews ignores both these links when using link_selections. Is this currently not supported or might I be doing something wrong.
If I make a selection now, the selection is only applied to the data in the plot (and the selection is not even visible).
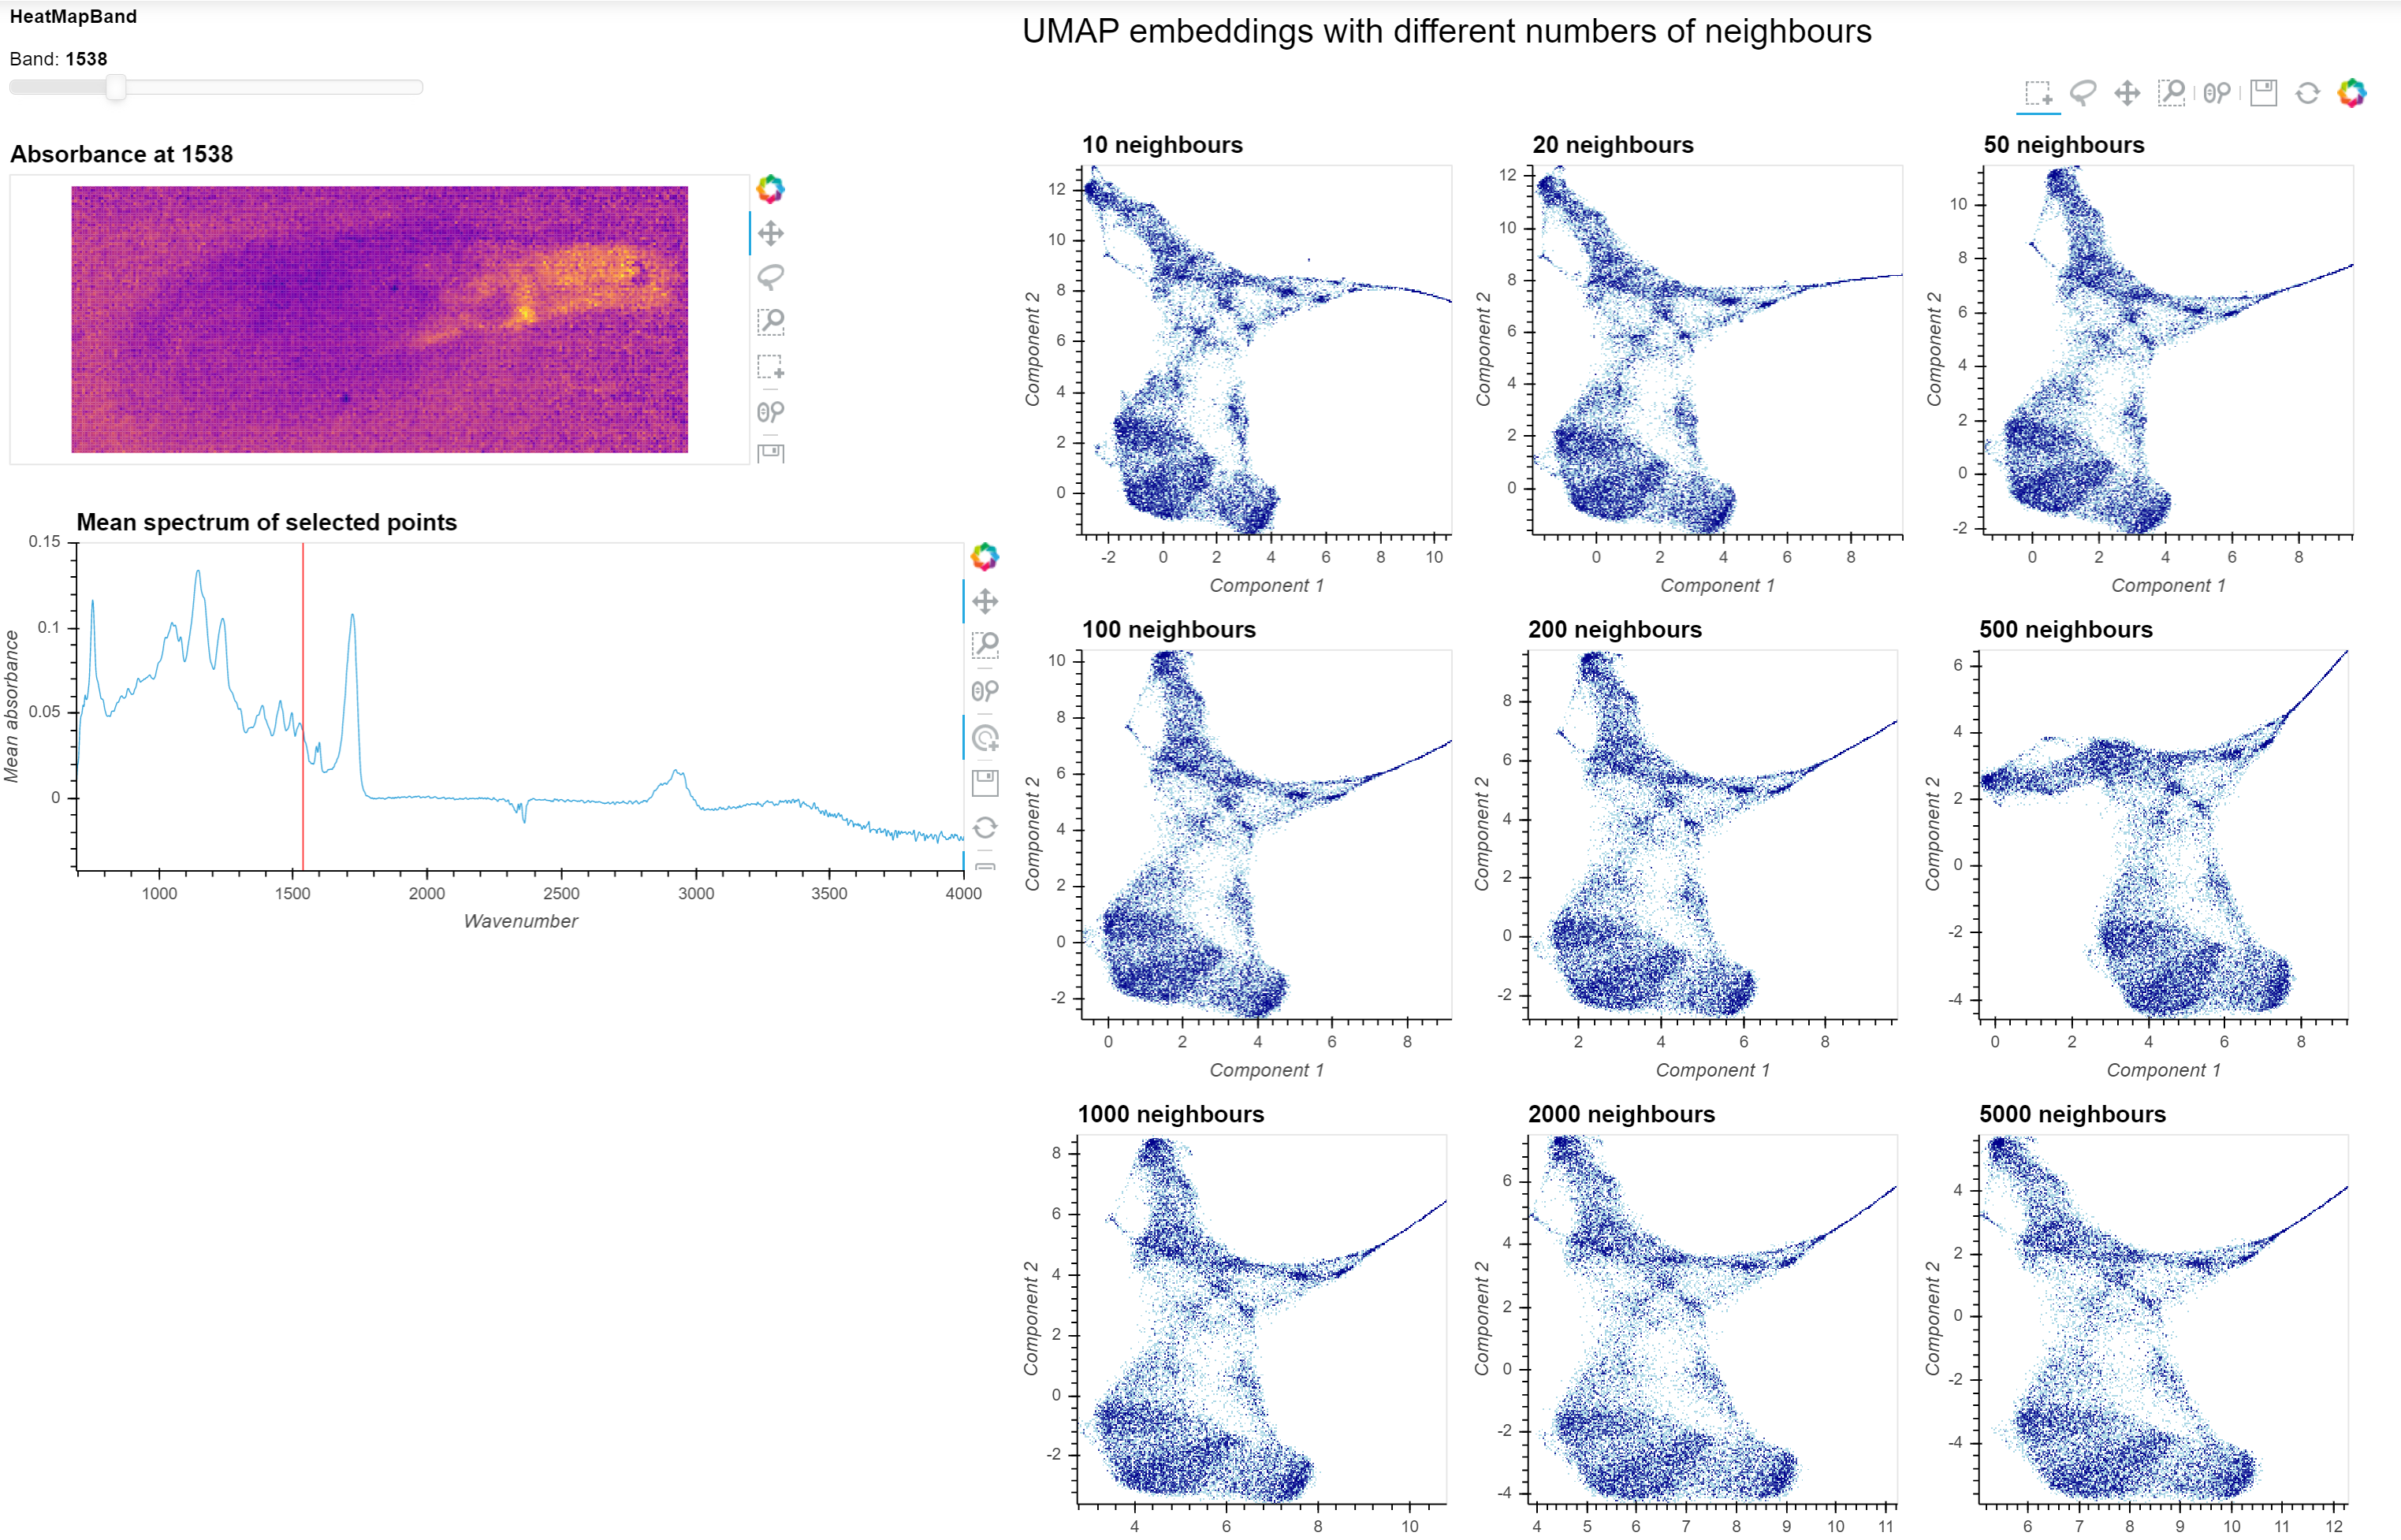
I have included a picture below of what it is supposed to look like (static mockup) in the end and I’ve included my code below but I’m not sure whether it is understandable. I understand its all quite a complex story, so I hope someone can help me.
import xarray as xr

# Get shape parameters from the data
x_len = selected_absorbance.shape[1]
y_len = selected_absorbance.shape[0]
embed_len = umap_embeddings2d["10n"].shape[1]

# Create coordinates
x = np.arange(1, x_len + 1)
y = np.arange(1, y_len + 1)
band = (np.arange(band_max, band_min+band_change, band_change)).astype(int)
idx = np.arange(y_len * x_len).reshape(x_len, y_len)

# Extract 2 components to plot
comp1 = deepcopy(umap_embeddings2d["10n"].iloc[:, 0].to_numpy()).reshape(x_len, y_len)
comp2 = deepcopy(umap_embeddings2d["10n"].iloc[:, 1].to_numpy()).reshape(x_len, y_len)

# Create the xr dataset
xrds = xr.Dataset(
    {
        "absorbance": (["y", "x", "band"], selected_absorbance),
    },
    coords={
        "x": x,
        "y": y,
        "band": band,
        "idx": (("x", "y"), idx),
        "comp1": (("x", "y"), comp1),
        "comp2": (("x", "y"), comp2),
    }
    )

# Set metadata
xrds.absorbance.attrs = dict(
    units = "Absorbance",
    standard_name = "absorbance_maps",
    long_name = "FTIR absorbance maps for every scanned wavelength",
)

xrds.band.attrs = dict(
    standard_name = "wavenumber",
    long_name = "Wavenumber",
    units = "cm⁻¹",
    step = 2,
)


# Dynamic heatmap class
class ImageBand(param.Parameterized):

    band = param.Integer(default=1538, bounds=(band_min, band_max), step=2)

    plot_options = param.Dict(dict(aspect="equal", cmap="Plasma"))

    @param.depends("band", "plot_options")
    def create_heatmap(self):

        return hv.HeatMap(xrds.sel(band=self.band), kdims=["x", "y"]).opts(**dict(title=f"Absorbance at {self.band}", **self.plot_options))


# Selection instance
sel3 = hv.selection.link_selections.instance()

band_select = ImageBand()
hm = sel3(band_select.create_heatmap().opts(tools=["box_select"]))

embed = sel3( datashade(
            hv.Points(xrds.sel(band=band), ["comp1", "comp2"], vdims=["absorbance"]),
        ) )

hv.Layout([hm, embed]).cols(1);