Dear All,
can we make this code become panel since currently it show separate/standlone. I try to make the 3D grid but can not, kindly please advise:
import numpy as np
import pyvista as pv
rng = np.random.default_rng(seed=0)
def make_point_set():
"""Return an n by 3 numpy array of structured coordinates.
The contents of this function can be ignored.
"""
n, m = 29, 32
x = np.linspace(-200, 200, num=n) + rng.uniform(-5, 5, size=n)
y = np.linspace(-200, 200, num=m) + rng.uniform(-5, 5, size=m)
xx, yy = np.meshgrid(x, y)
A, b = 100, 100
zz = A * np.exp(-0.5 * ((xx / b) ** 2.0 + (yy / b) ** 2.0))
points = np.c_[xx.reshape(-1), yy.reshape(-1), zz.reshape(-1)]
foo = pv.PolyData(points)
foo.rotate_z(36.6, inplace=True)
return foo.points
# Get the points as a 2D NumPy array (N by 3)
points = make_point_set()
points[0:5, :]
mesh = pv.StructuredGrid()
mesh.points = points
mesh.dimensions = (29, 32, 1)
# Create scalar data
scalars = mesh.points[:, 2]
mesh['elevation'] = scalars
plotter = pv.Plotter(window_size=[1200, 800])
# Add the main mesh
plotter.add_mesh(mesh, scalars='elevation', show_edges=True,
cmap='plasma', opacity=0.9,
show_scalar_bar=True, scalar_bar_args={'title': 'Elevation'})
# Enhanced grid and axes
plotter.show_grid(color='gray', location='outer')
plotter.add_axes(interactive=True, line_width=5)
# Set multiple camera positions
plotter.camera_position = 'xy' # Top-down view
# Add some text
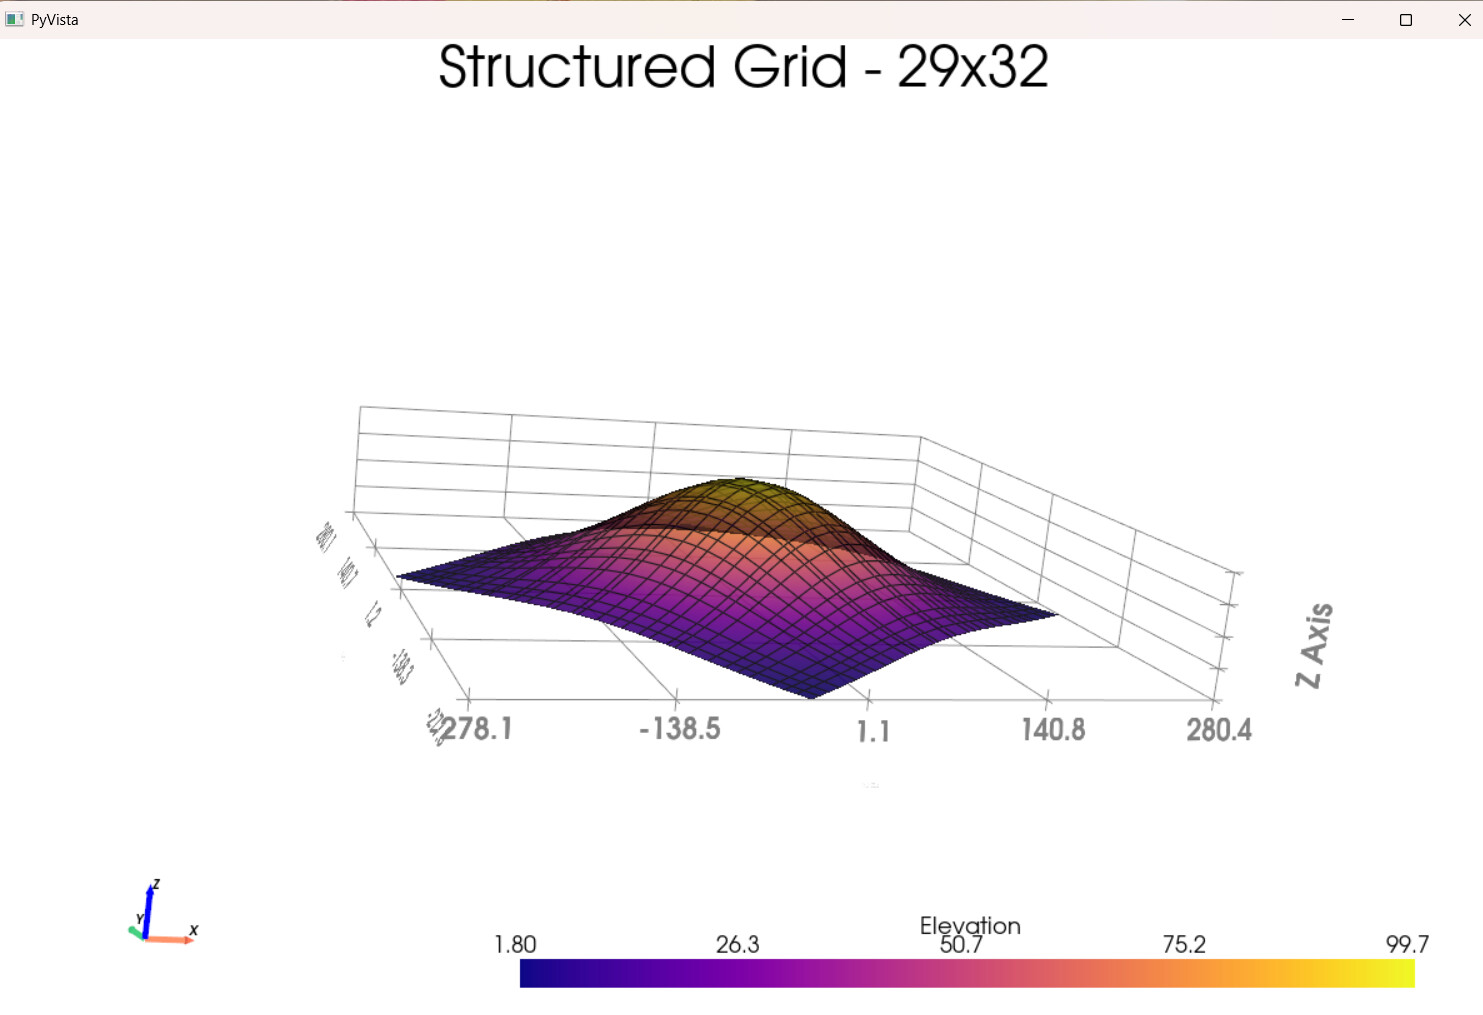
plotter.add_text("Structured Grid - 29x32", position='upper_edge')
# Enable advanced interactions
plotter.enable_terrain_style(mouse_wheel_zooms=True)
plotter.enable_trackball_style() # Alternative interaction style
# Show the interactive plot
plotter.show()
thanks