This is just a small showcase for hvplot. I was developing an application where I needed a 4 columns by 6 rows layout of plots with a shared legend.
I did not know how to do this and could not find any documentation. But I found out I can do this by setting the legend manually on each plot.
import panel as pn
import hvplot.pandas
import pandas as pd
pn.extension("plotly", sizing_mode="stretch_width")
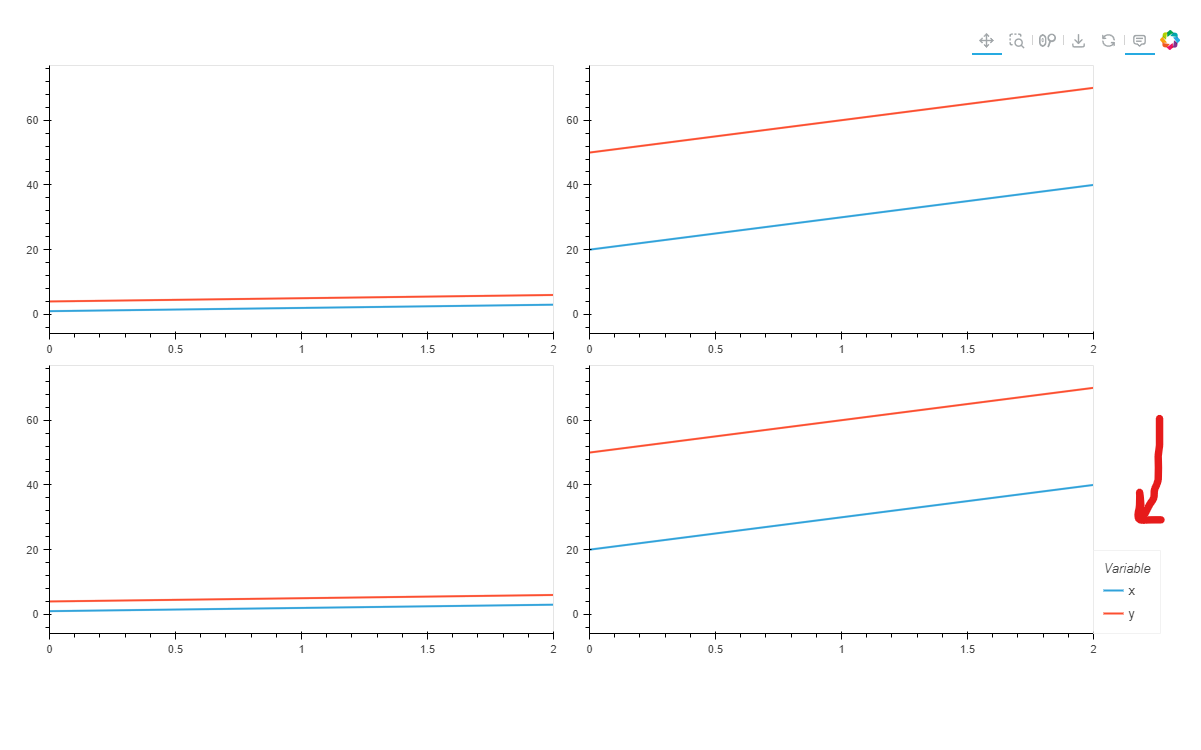
data1 = pd.DataFrame({"x": [1, 2, 3], "y": [4, 5, 6]})
data2 = pd.DataFrame({"x": [20, 30, 40], "y": [50, 60, 70]})
data3 = pd.DataFrame({"x": [1, 2, 3], "y": [4, 5, 6]})
data4 = pd.DataFrame({"x": [20, 30, 40], "y": [50, 60, 70]})
plot_layout = (
data1.hvplot(responsive=True, height=300, legend=False)
+ data2.hvplot(responsive=True, height=300, legend=False)
+ data3.hvplot(responsive=True, height=300, legend=False)
+ data4.hvplot(responsive=True, height=300, legend="right")
).cols(2)
pn.panel(
plot_layout,
margin=25,
).servable()