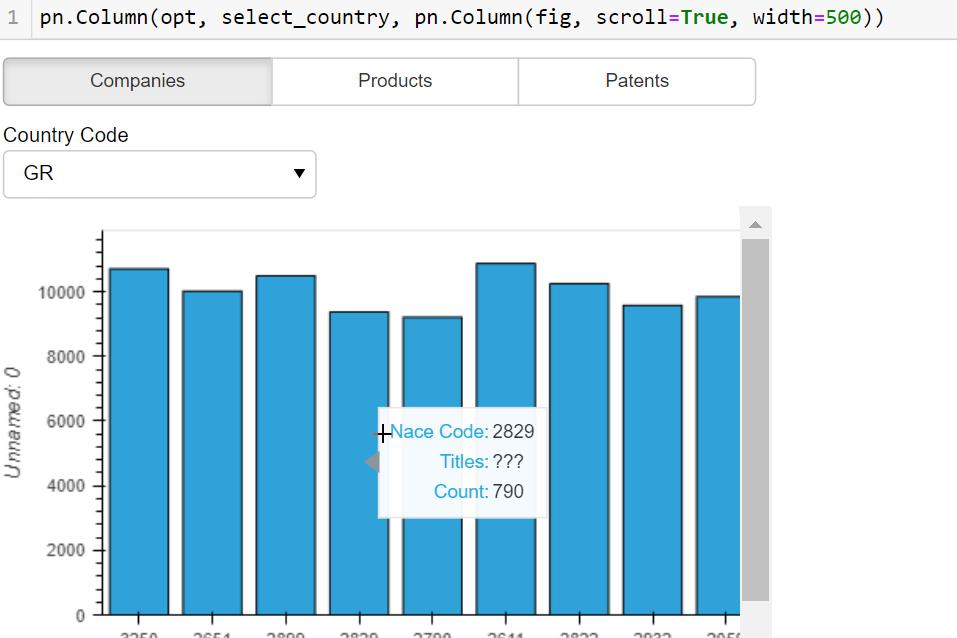
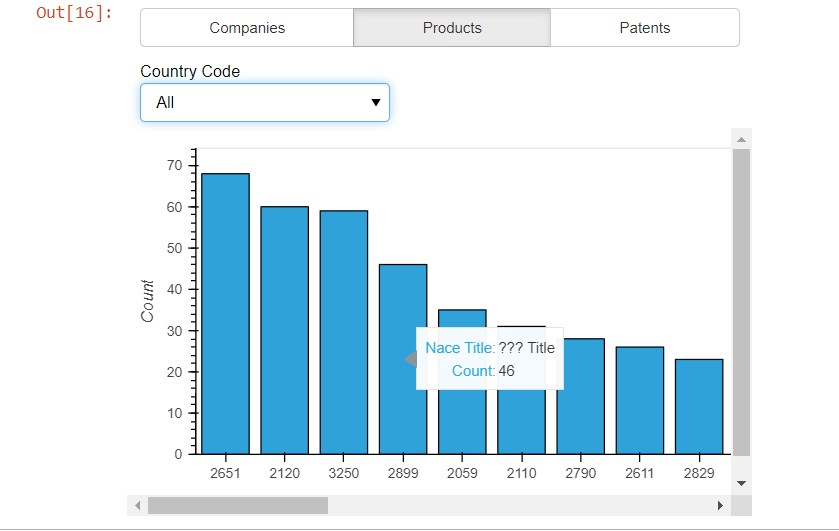
Hi, I want to add a new variable to the hover tool in an interactive bar chart, however, the value of the variable would be shown as " ???" as can be seen in the attached screenshot.
I provided the code and an example of data used in the code.
products:
products_test.csv (5.2 KB)
patents:
patents_test.csv (3.6 KB)
companies:
companies_test.csv (14.9 KB)
title_list:
Nace code titles list.csv (13.0 KB)
import panel as pn
import panel.widgets as pnw
import holoviews as hv
from bokeh.plotting import figure
from bokeh.models import Div, CustomJS, RadioButtonGroup

from bokeh.models.widgets import Panel, Tabs
hv.extension('bokeh')

from bokeh.models import HoverTool, BoxZoomTool, ResetTool, PanTool, WheelZoomTool, SaveTool, LassoSelectTool
LABELS = ["Companies", "Products", "Patents"]

nacettl = pd.read_csv('title_list.csv', dtype={'Nace code':str}).rename(columns = {'Nace code':'Nace Code'})

opt = pnw.RadioButtonGroup(options = LABELS)
@pn.depends(opt = opt.param.value)
def country_list(opt):

    if opt == 'Patents':
        l = ["All"] + list(patents['Country Code'].unique())

    elif opt == 'Products':
        l = ["All"] + list(products['Country Code'].unique())

    else:
        l = ["All"] + list(companies['Country Code'].unique())


    return l

select_country = pnw.Select(name = 'Country Code', options = country_list(opt) , value = "All", width = 200)

@pn.depends(select_country = select_country.param.value, opt = opt.param.value )


def fig(select_country,opt):

    if opt == 'Companies':
        df = companies
        string = '(Companies)'

    elif opt == 'Products':
        df = products
        string = '(Products)'
    else:
        opt = patents
        string = '(Patents)'


    df = pd.merge(df,nacettl, how = 'inner', on = ['Nace Code'])

    hover = HoverTool(description='Custom Tooltip', tooltips = [('Nace Title', '@Nace Title'),('Count', '@Count')])
    opts = dict(width = 1500, height = 300, line_color = 'black' ,
                 tools = [hover], apply_ranges = True)

    if select_country == "All":
        selected = df.groupby(['Nace Code']).sum().reset_index().rename(columns = {0:'Count'}).sort_values(by ='Count', ascending = False )[:30]
        selected
    else:
        selected = df[df['Country Code'] == select_country].sort_values(by ='Count', ascending = False )[:30]

    return hv.Bars(selected, 'Nace Code', 'Count').opts(**opts)

pn.Column(opt, select_country, pn.Column(fig, scroll=True, width=500))