Add additional info to hv.Distribution tooltip

I understand from scouring the discourse and GitHub sites that hv.Area has issues with tooltips for the hover tool (see Hovertool on hv.Area only output questionmark · Issue #5375 · holoviz/holoviews (github.com)).

I am currently developing some tools where there are often >50 distributions to be plotted, and thus makes it difficult to identify which curve is which without useful identifying info in the tooltip. I am hoping that someone has an idea of how to add some fixed metadata for each curve in an hv.Distribution plot.

For example, how would I add a useful tooltip with info from the “ID” and “Variable” columns from the dataframe below:

import pandas as pd
import holoviews as hv
from bokeh.models import HoverTool

hv.extension('bokeh')

df = pd.DataFrame(
    [np.random.choice(['ID1', 'ID2', 'ID3', 'ID4'], size=100),
    np.random.uniform(0, 1, size=100)],
    index = ['ID', 'value']
).T.infer_objects()
df['Variable'] = df['ID'].map({'ID1': 'x', 'ID2': 'x', 'ID3': 'y', 'ID4': 'z'})

hover = HoverTool(tooltips = [("ID", '@ID'), ("Variable", "@Variable")])
hv.Overlay(
    [(i, hv.Distribution(df[df['ID']==i]['value'], label=i).opts(fill_color=c, tools=[hover])) for i, c in zip(df['ID'].unique(), ['red', 'blue', 'grey', 'purple'])]
).opts(legend_position='right', width=600, height=400)

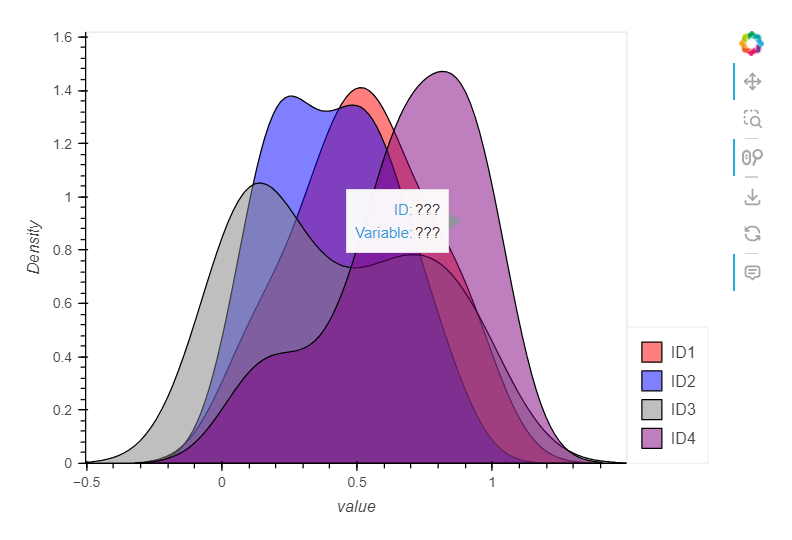
I understand that in the code above I am only providing the values from the “value” column to hv.Distribution, hence the “???” output, but I can’t figure out how to supply additional columns to get included in the plot data so that they can be recognized by the hover tool.

If I could even just get the overlay label to show up in the tooltip, that would be sufficient for my purposes.

Thanks in advance for any help!

Something like this with hvplot, but I think there’s a bug.

import pandas as pd
import hvplot.pandas
import numpy as np

import holoviews as hv
from bokeh.models import HoverTool

hv.extension('bokeh')

df = pd.DataFrame(
    [np.random.choice(['ID1', 'ID2', 'ID3', 'ID4'], size=100),
    np.random.uniform(0, 1, size=100)],
    index = ['ID', 'value']
).T.infer_objects()
df['Variable'] = df['ID'].map({'ID1': 'x', 'ID2': 'x', 'ID3': 'y', 'ID4': 'z'})
df.hvplot.kde("value", by="ID", hover_cols=["Variable", "ID"])

@ahuang11 yeah, I also tried hvplot with no luck … Suffers from the same bug as hv.Distribution. I was hoping there might be a way around it, perhaps with hooks, but I have no idea how to implement.

One way is to look through the internal codebase of HoloViews under hv.Area / hv.Distribution and see what variable they renamed it to!

Also, can you submit a bug so it’s tracked on GitHub (and maybe a PR too if you figure it out!)

For example, RasterPlot and its subclasses uses @image

I appreciate the ideas… I took a look through the code base, but wasn’t able to come up with any solutions. I did, however, just come across this in-progress PR ( Add group and label to hover tooltip if provided by user by droumis · Pull Request #6125 · holoviz/holoviews (github.com)) which essentially does what I’m looking for, albeit to a more limited extent since it only adds the plot label, not other variables, to the tooltip.

Given that the hv.Area issues with tooltips are already well documented in the GitHub issues and considering the above PR, I think I will refrain from posting a duplicate issue.

In the meantime, I did find that the label is automatically added to the tooltip when opts.Distribution(filled=False), so for now I will just use the unfilled distribution curves.

1 Like

If performance isn’t an issue, you could theoretically stack opts.Distribution(filled=True, line_alpha=0) with not filled, and then remove the hover the the filled

1 Like