Taking the example here
https://hvplot.holoviz.org/reference/pandas/scatter.html
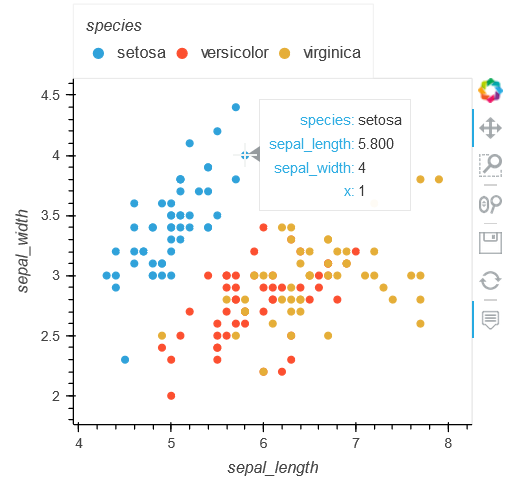
If I add another field
df[‘x’] = 1
How would I make these show up in the box when hovering over the points
e.g. would now show [[‘species’, ‘sepal_length’, ‘sepal_width’, ‘x’]]
Edit: Actually I don’t need to add another field I could look at adding ‘petal_width’ to the plot
This can be done by using hover_cols like here, if you want all columns you can add "all" instead of the list:
df.hvplot.scatter(x='sepal_length', y='sepal_width', by='species',
                  legend='top', height=400, width=400, hover_cols=["species", "sepal_length", "sepal_width", "x"])
2 Likes
Hi @Hoxbro,
A follow-up question on hover_cols – is there a similar option for other plot types?
dd = pd.DataFrame({
    'key' : ['A'] * 6 + ['B'] * 6,
    'val' : [1,2,3,4,5,10,6,7,8,9,10,15], #range(12),
    'info': ['label ' + str(x) for x in range(12)]
})

hv.BoxWhisker(dd, vdims='val', kdims='key', hover_cols='all')
I see the box plot but no hover. The following error messages shows up:
20210527 11:47:59.166960996|WARN ||Setting non-parameter attribute hover_cols=all using a mechanism intended only for parameters|
Pass more data into vdims
vdims=['val', 'info'] then tools=['hover']
Hi @ahuang11 ,
Thanks for the suggestions. This additional vdim
hv.Curve(dd, vdims=['val', 'info'], kdims='key').opts(tools=['hover'])
works for hv.Curve, but not hv.BoxWhisker. I’ll try to dig into the code to and find out what is happening…
BoxWhisker aggregates things. I think you may just want to overlay a Scatter over BoxWhisker if you want the extra hover.
1 Like
Oh that makes sense… Thanks!