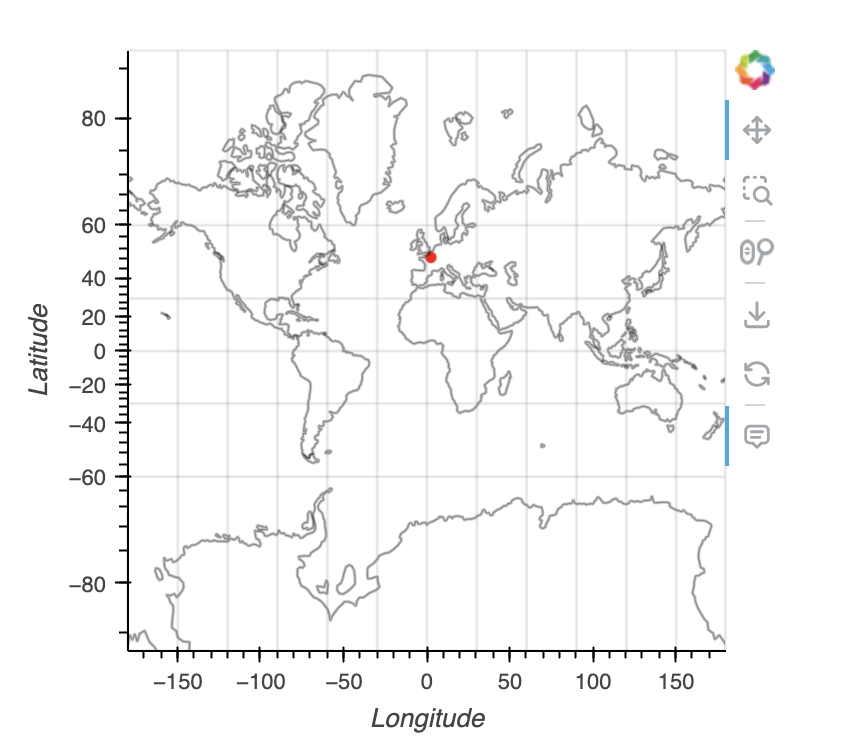
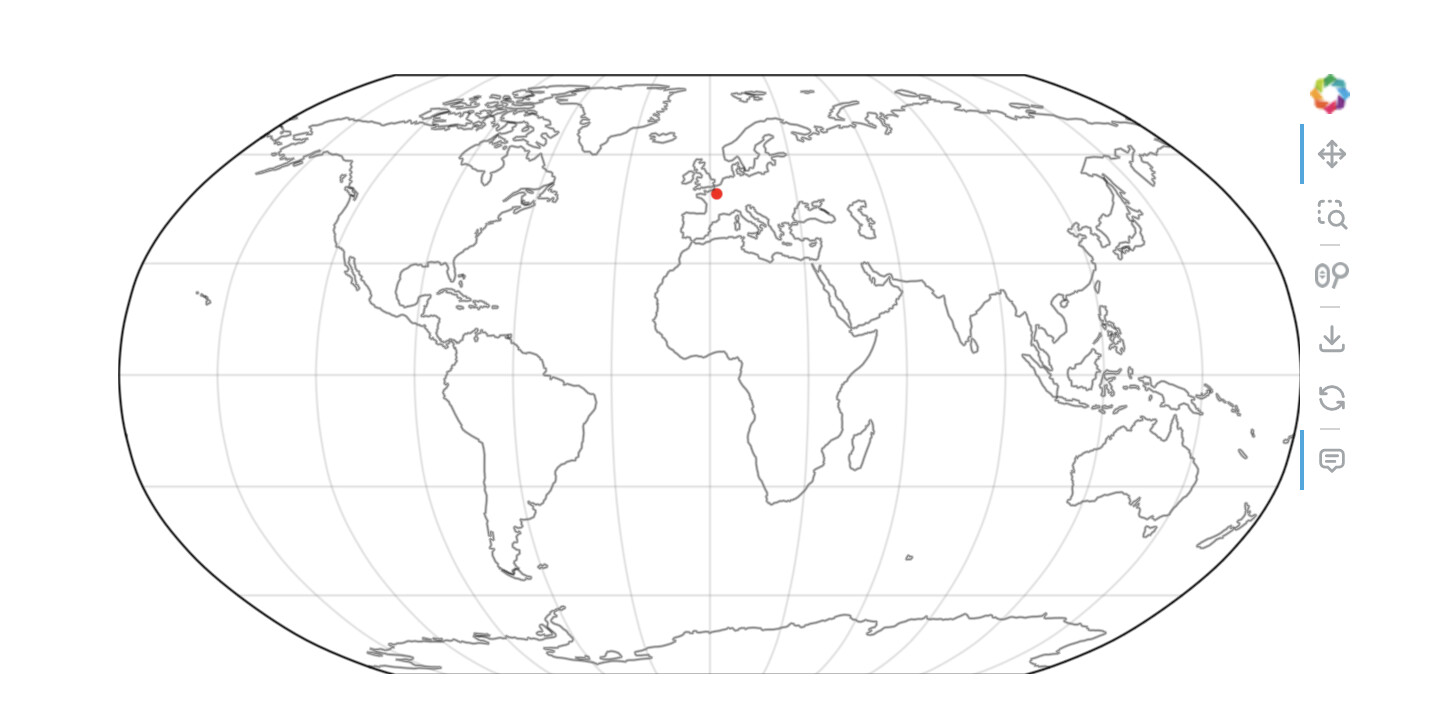
Hi I’m trying to add some tick labels (longitude, latitude) to a global map. When I’m using a ccrs.GOOGLE_MERCATOR projection the ticks are added by default. However, when I plot my data in another projection (e.g., Robinson) the there are no tick labels.
import cartopy.crs as ccrs
import geopandas as gpd
import geoviews as gv
import geoviews.feature as gf
import holoviews as hv
import hvplot.pandas
import shapely

hv.extension("bokeh")

gdf = gpd.GeoDataFrame(geometry=[shapely.Point(2.35, 48.85)], crs=4326)

projection = ccrs.GOOGLE_MERCATOR # works as expected
projection = ccrs.Robinson()  # no lon/lat tick labels..

gdf_plot = gdf.hvplot(
    geo=True,
    size=20,
    color="red",
    projection=projection,
    features=["coastline"],
    global_extent=True,
)

grid = gf.grid(show_title=False)

gdf_plot * grid
Unfortunately, I’m not sure it’s supported. The workaround is to add labels manually to the grid
ahh ok, and how would you recommend to manually add labels to the grid?
import geoviews as gv

gv.Labels(kdims=[lons, lats], vdims=[labels])
Or hvplot
import hvplot.pandas

labels_df = pd.DataFrame(...)
labels_df.hvplot("lon", "lat", "labels") * your_other_plot
Or use tiles’ labels /as a spatial reference.
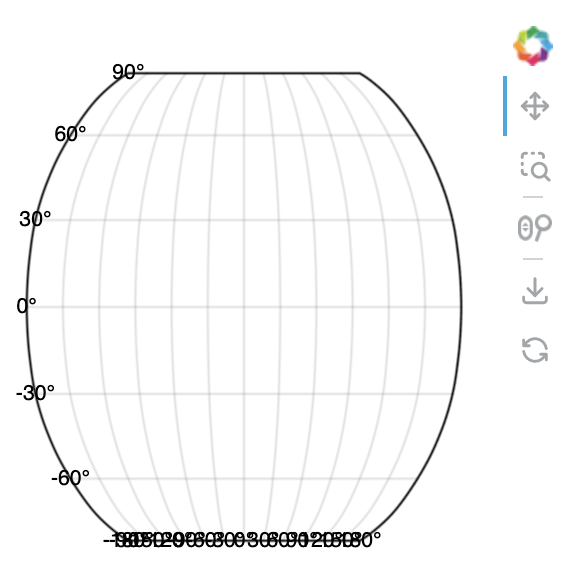
TY! Although I’m still not very happy with the result. I didn’t manage to place the text outside the map yet. When you set coordinates to LT -90 or LT -180 (to move the text outside the map) it obviously maps them on the other side of th world or doesn’t show them. Do you see any easy workaround? Or maybe I should just stick to GOOGLE_MERCATOR when I want tick labels.
import geoviews as gv
import holoviews as hv
import numpy as np
import pandas as pd
from cartopy import crs as ccrs
from holoviews import opts

hv.extension("bokeh")

# Create a grid feature
grid_plot = gv.feature.grid(
    projection=ccrs.Robinson(), title="", fill_color="none", color="gray"
)

longitudes = np.arange(-180, 181, 30)
latitudes = np.arange(-90, 91, 30)

# Generate labels for longitudes and latitudes
lon_labels = [f"{lon}°" for lon in longitudes]
lat_labels = [f"{lat}°" for lat in latitudes]

labels_data = {
    "lon": list(longitudes) + [-180] * len(latitudes),
    "lat": [-90] * len(longitudes) + list(latitudes),
    "label": lon_labels + lat_labels,
}

df_labels = pd.DataFrame(labels_data)

labels_plot = gv.Labels(df_labels, kdims=["lon", "lat"], vdims=["label"]).opts(
    text_font_size="8pt",
    text_color="black",
    projection=ccrs.Robinson(),
)

# Overlay the labels on the grid
plot = grid_plot * labels_plot
plot
I would play around with:
text_align and text_baseline