Add Sparkline Formatters to Tabulator

In Jupyter Notebook it seems

  • Jquery should not be imported
  • Tabulator should be imported via pn.extension("tabulator") first. Then the sparklines js can be imported.

I think this is a good enough solution for manual use. But if you want to distribute a module or package that works for all 3 environments. Then more than the above is needed.

You could consider adding a Feature Request to get spark lines supported with Tabulator by default in Panel or having an example in the Gallery.

The problem is jquery. Its difficult to include in Jupyter, Panel and in general as far as I understand.

1 Like

The point about jQuery is a good one. In classic jupyter it doesn’t need to be included at all while in jupyterlab it does. We already have a few components depending on it. Right now if multiple components depend on it, it’ll just use the first version that is loaded but we need to make sure that we align on the versions that are loaded and just define the jQuery requirement in a single place

Thanks a lot!
It is working now in Jupyter Lab locally for me. Strangely, I could not reproduce the solution for jupyter notebook.

Still I am unsure how i solve this issue with voila and I’ve wrote them on

Nothing you can do about this, I think. :wink:

It would be really nice to have this feature working everywhere.

1 Like

Hi @Marc ,

I tried that code in panel 0.13. But it did not work for me.

Thanks in advance.

Hi @nemesis

I just tried it with Panel 0.14.1 and panel serve. It works perfectly for me
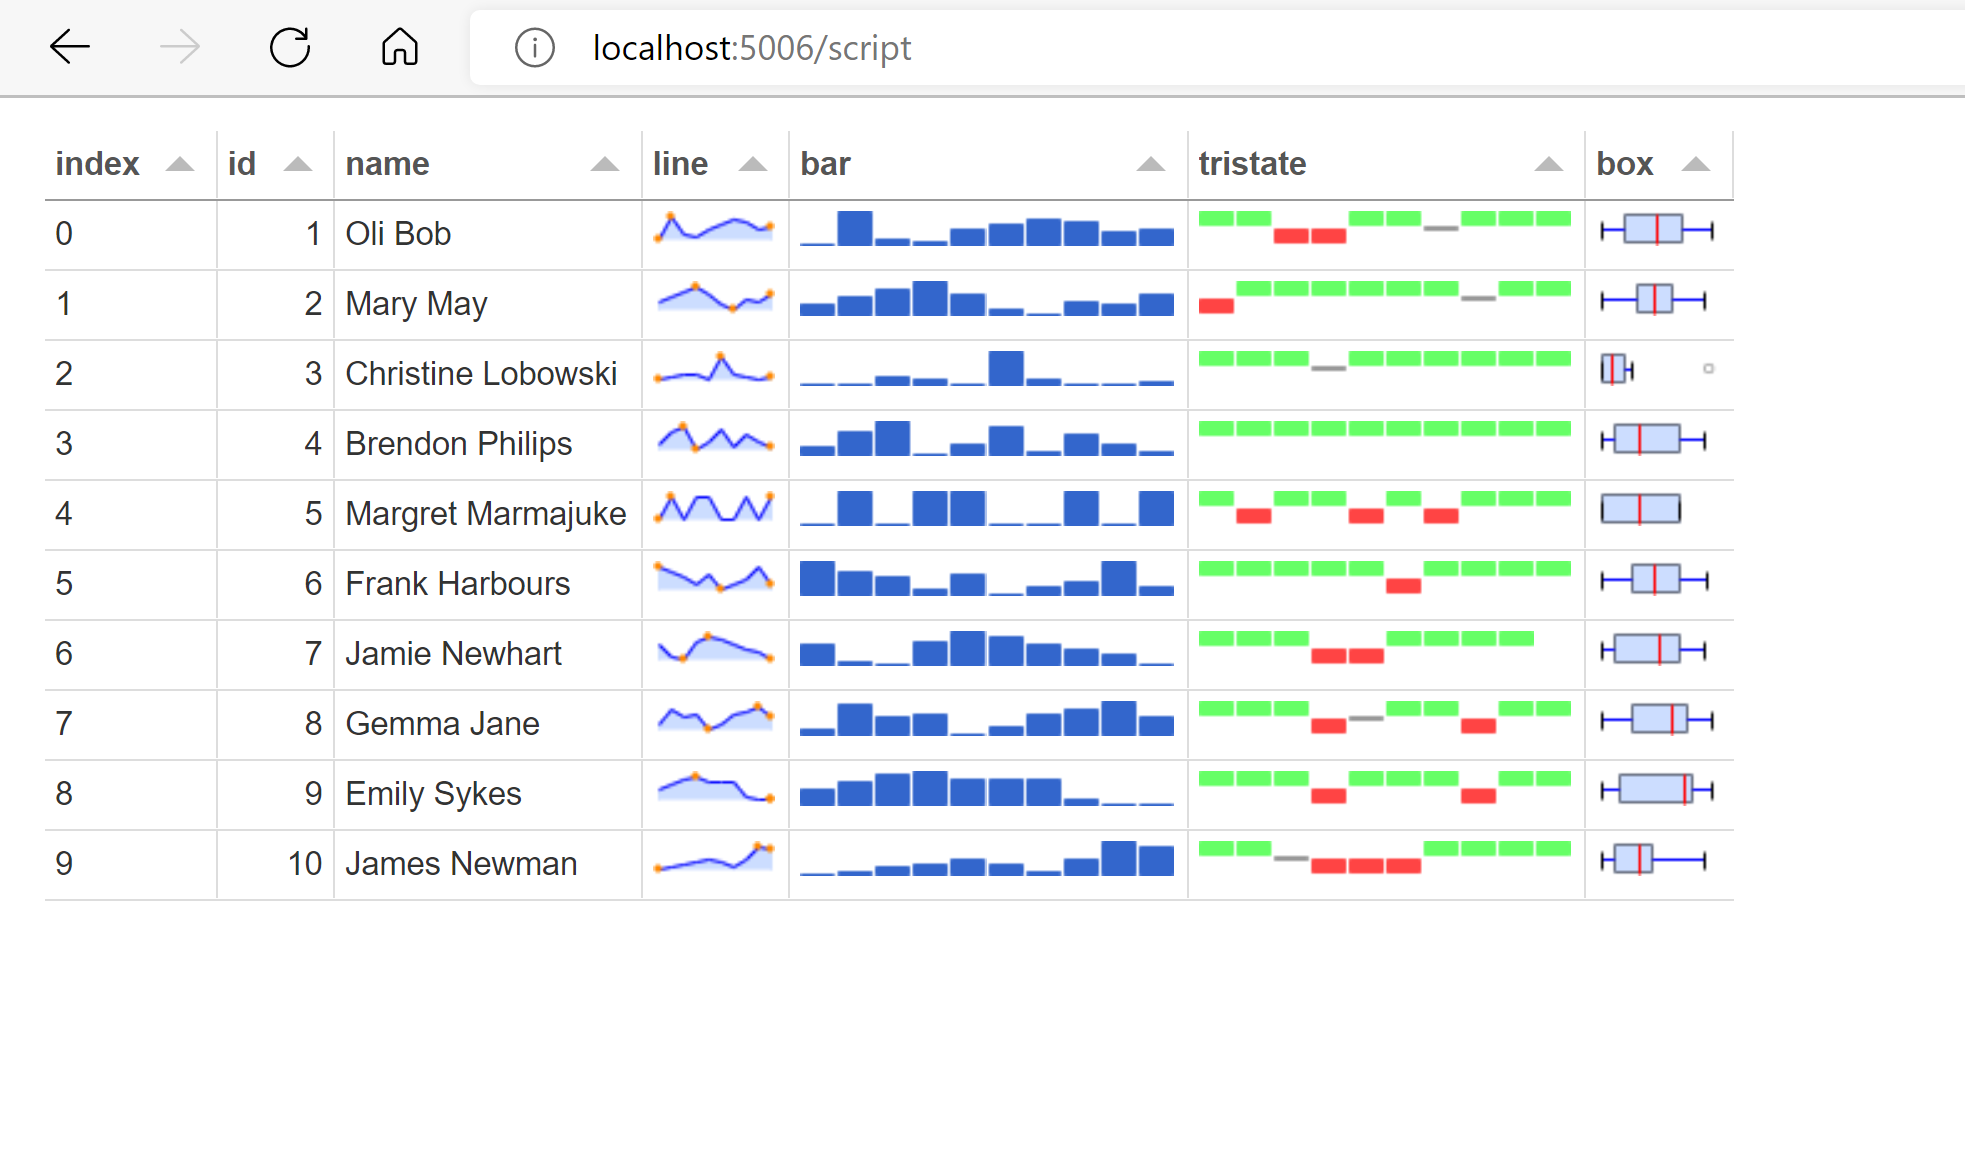
import pandas as pd
import panel as pn

pn.config.js_files["jquery"]="https://code.jquery.com/jquery-1.12.4.min.js"
pn.config.js_files["sparkline"]="https://cdnjs.cloudflare.com/ajax/libs/jquery-sparklines/2.1.2/jquery.sparkline.min.js"
pn.config.js_files["sparkline_to_tabulator"]="https://cdn.jsdelivr.net/gh/MarcSkovMadsen/awesome-panel-assets@master/js/add_spark_lines_to_tabulator.min.js"


pn.extension('tabulator')

sparkData = [
    dict(id=1, name="Oli Bob", line=[1, 20, 5, 3, 10, 13, 17, 15, 9, 11], bar=[1, 20, 5, 3, 10, 13, 17, 15, 9, 11], tristate=[1, 20, -5, -3, 10, 13, 0, 15, 9, 11], box=[1, 20, 5, 3, 10, 13, 17, 15, 9, 11]),
    dict(id=2, name="Mary May", line=[10, 12, 14, 16, 13, 9, 7, 11, 10, 13], bar=[10, 12, 14, 16, 13, 9, 7, 11, 10, 13], tristate=[-10, 12, 14, 16, 13, 9, 7, 0, 10, 13], box=[10, 12, 14, 16, 13, 9, 7, 11, 10, 13]),
    dict(id=3, name="Christine Lobowski", line=[1, 2, 5, 4, 1, 16, 4, 2, 1, 3], bar=[1, 2, 5, 4, 1, 16, 4, 2, 1, 3], tristate=[1, 2, 5, 0, 1, 16, 4, 2, 1, 3], box=[1, 2, 5, 4, 1, 16, 4, 2, 1, 3]),
    dict(id=4, name="Brendon Philips", line=[3, 7, 9, 1, 4, 8, 2, 6, 4, 2], bar=[3, 7, 9, 1, 4, 8, 2, 6, 4, 2], tristate=[3, 7, 9, 1, 4, 8, 2, 6, 4, 2], box=[3, 7, 9, 1, 4, 8, 2, 6, 4, 2]),
    dict(id=5, name="Margret Marmajuke", line=[1, 3, 1, 3, 3, 1, 1, 3, 1, 3], bar=[1, 3, 1, 3, 3, 1, 1, 3, 1, 3], tristate=[1, -3, 1, 3, -3, 1, -1, 3, 1, 3], box=[1, 3, 1, 3, 3, 1, 1, 3, 1, 3]),
    dict(id=6, name="Frank Harbours", line=[20, 17, 15, 11, 16, 9, 12, 14, 20, 12], bar=[20, 17, 15, 11, 16, 9, 12, 14, 20, 12], tristate=[20, 17, 15, 11, 16, -9, 12, 14, 20, 12], box=[20, 17, 15, 11, 16, 9, 12, 14, 20, 12]),
    dict(id=7, name="Jamie Newhart", line=[11, 7, 6, 12, 14, 13, 11, 10, 9, 6], bar=[11, 7, 6, 12, 14, 13, 11, 10, 9, 6], tristate=[11, 7, 6, -12, 1-13, 11, 10, 9, 6], box=[11, 7, 6, 12, 14, 13, 11, 10, 9, 6]),
    dict(id=8, name="Gemma Jane", line=[4, 17, 11, 12, 0, 5, 12, 14, 18, 11], bar=[4, 17, 11, 12, 0, 5, 12, 14, 18, 11], tristate=[4, 17, 11, -12, 0, 5, 12, -14, 18, 11], box=[4, 17, 11, 12, 0, 5, 12, 14, 18, 11]),
    dict(id=9, name="Emily Sykes", line=[11, 15, 19, 20, 17, 16, 16, 5, 3, 2], bar=[11, 15, 19, 20, 17, 16, 16, 5, 3, 2], tristate=[11, 15, 19, -20, 17, 16, 16, -5, 3, 2], box=[11, 15, 19, 20, 17, 16, 16, 5, 3, 2]),
    dict(id=10, name="James Newman", line=[1, 2, 3, 4, 5, 4, 2, 5, 9, 8], bar=[1, 2, 3, 4, 5, 4, 2, 5, 9, 8], tristate=[1, 2, 0, -4, -5, -4, 2, 5, 9, 8], box=[1, 2, 3, 4, 5, 4, 2, 5, 9, 8]),
]

sparkData = pd.DataFrame(sparkData)

tabulator_formatters = {
    'line': {'type': 'spark_line'},
    'bar': {'type': 'spark_bar'},
    'tristate': {'type': 'spark_tristate'},
    'box': {'type': 'spark_box'},
}
table = pn.widgets.Tabulator(sparkData, formatters=tabulator_formatters)

pn.Column(
    table
).servable()
1 Like

Hi @Marc ;

Thanks. I will try to install panel 0.14.1. Is there any known issue on panel 0.14. I’m also using panel-high charts and echarts in my dashboard.

1 Like

Hi @nemesis

The issues I am aware of were in 0.14.0 and solved in 0.14.1.

I’ve also updated panel-highcharts to support panel 0.14

Hi @Marc ;

I upgraded panel to 0.14.1. I can’t see sparkline in table. Probably I’m making mistake.

My code to launch your code is :
panel serve --port 4004 sparkli.py --check-unused-sessions 5000 --unused-session-lifetime 1000

@nemesis it also works for me. I could suspect it could be a cache problem.

Try hard-refresh your browser with ctrl+shift+r.

Hi @Hoxbro ;

I tried but result is same. I’m also receiving some message but I’m not sure they are important

2022-11-11 11:22:45,234 Bokeh app running at: http://localhost:4004/sparkli
2022-11-11 11:22:45,234 Starting Bokeh server with process id: 4417
2022-11-11 11:22:47,543 WebSocket connection opened
2022-11-11 11:22:47,543 ServerConnection created
2022-11-11 11:22:53,994 WebSocket connection opened
2022-11-11 11:22:53,995 ServerConnection created
2022-11-11 11:22:54,043 404 GET /favicon.ico (::1) 0.30ms
2022-11-11 11:22:54,072 404 GET /apple-touch-icon-precomposed.png (::1) 0.19ms
2022-11-11 11:22:54,072 404 GET /apple-touch-icon.png (::1) 0.27ms
2022-11-11 11:22:58,677 WebSocket connection opened
2022-11-11 11:22:58,678 ServerConnection created
2022-11-11 11:22:58,679 404 GET /favicon.ico (::1) 1.32ms

The messages are not important.

Are you sure you are running with panel 1.14.1?

Try opening a private window and see what happens.

Hoxbro, after restart, it worked. I don’t know why restart changed it. Apologize for taking both of your time. Probably I made a mistake in somewhere.

I have one more question. Should I add tabulator into pn.extension? I’m also adding highcharts, echarts. Is there any limitation?

1 Like

No worries. You probably had a caching problem which the restart fixed.

As far as I know, there shouldn’t be any problem with it.

If you don’t mind, I want to ask one more question. Can I arrange the size of cell height? So sparkline will be more readable.

Yes. Use a static configuration like shown here Tabulator — Panel v0.14.1.

Even if we increase the height, it is not effecting sparkline dimensions. Is there any way to resize sparkline ?

I don’t think there is a straightforward way to this. Maybe the JS code here: pn.config.js_files["sparkline_to_tabulator"]="https://cdn.jsdelivr.net/gh/MarcSkovMadsen/awesome-panel-assets@master/js/add_spark_lines_to_tabulator.min.js" should be updated to have `height: “100%”. But I’m not sure.

1 Like

Hi

I am using the code which shared by Marc and it is working really well.

Just a questions:
When I clicked the cell, The plot gone, Just curious, if we have any suggestion here

Kind regards
Victor

if you set it disabled, it should work.