Hey there, I haven’t heard back but I thought I’d post a workaround that seems to be functional. Everyone is so helpful here, I figured it could be of use.
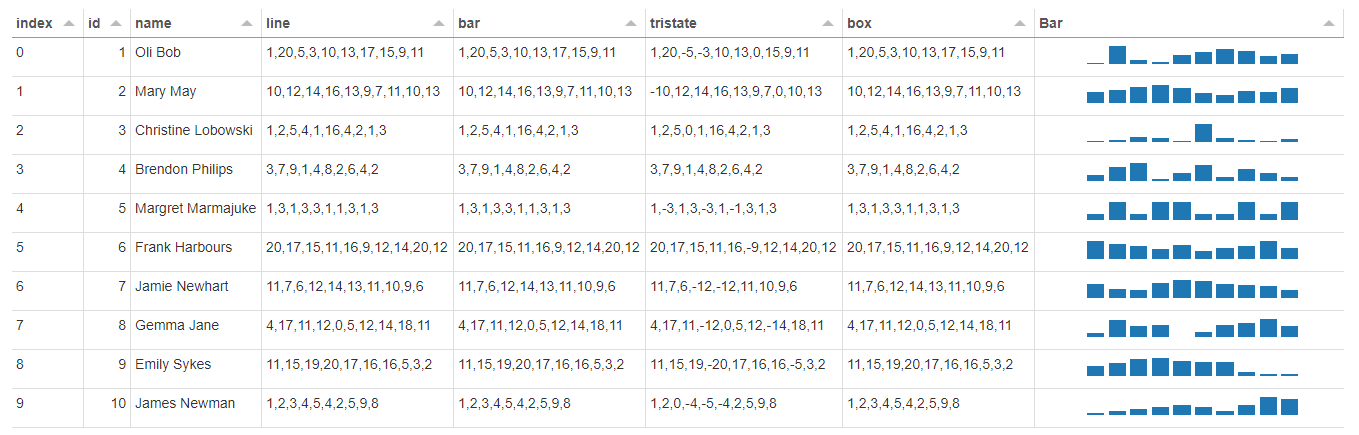
Instead of the super cool version of sparklines that are more interactive, i.e., have cooler mouse-over effects, here’s a base64 image based version which works decently enough.
Hope others can appreciate. Enjoy and thanks for a tremendous community/tool.
import pandas as pd
import numpy as np
import matplotlib.pyplot as plt
import base64
from base64 import b64encode
from io import BytesIO
from IPython.display import HTML
import os
pn.extension('tabulator')
# Borrowed from: https://towardsdatascience.com/6-things-that-you-probably-didnt-know-you-could-do-with-pandas-d365b3362a55
def create_line(data, **kwags):
# Convert data to a list
data = list(data)
labels = range(0,len(data))
# Create a figure and axis object with given size and keyword arguments
fig, ax = plt.subplots(1, 1, figsize=(3, 0.25), **kwags)
# Plot the data
#ax.plot(data)
ax.bar(labels, data)
# Remove the spines from the plot
for k,v in ax.spines.items():
v.set_visible(False)
# Remove the tick marks from the x and y axes
ax.set_xticks([])
ax.set_yticks([])
# Close the plot to prevent displaying it
plt.close(fig)
# Save the plot image as png and get its binary data
img = BytesIO()
fig.savefig(img, format='png')
encoded = b64encode(img.getvalue()).decode('utf-8')
# Return the encoded image data as an HTML image tag
return 'data:image/png;base64,{}'.format(encoded)
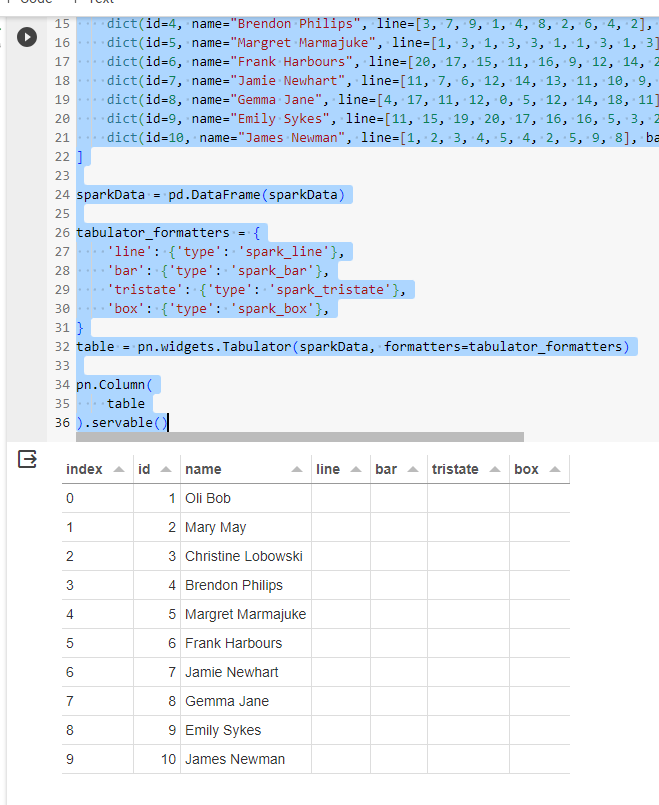
sparkData = [
dict(id=1, name="Oli Bob", line=[1, 20, 5, 3, 10, 13, 17, 15, 9, 11], bar=[1, 20, 5, 3, 10, 13, 17, 15, 9, 11], tristate=[1, 20, -5, -3, 10, 13, 0, 15, 9, 11], box=[1, 20, 5, 3, 10, 13, 17, 15, 9, 11]),
dict(id=2, name="Mary May", line=[10, 12, 14, 16, 13, 9, 7, 11, 10, 13], bar=[10, 12, 14, 16, 13, 9, 7, 11, 10, 13], tristate=[-10, 12, 14, 16, 13, 9, 7, 0, 10, 13], box=[10, 12, 14, 16, 13, 9, 7, 11, 10, 13]),
dict(id=3, name="Christine Lobowski", line=[1, 2, 5, 4, 1, 16, 4, 2, 1, 3], bar=[1, 2, 5, 4, 1, 16, 4, 2, 1, 3], tristate=[1, 2, 5, 0, 1, 16, 4, 2, 1, 3], box=[1, 2, 5, 4, 1, 16, 4, 2, 1, 3]),
dict(id=4, name="Brendon Philips", line=[3, 7, 9, 1, 4, 8, 2, 6, 4, 2], bar=[3, 7, 9, 1, 4, 8, 2, 6, 4, 2], tristate=[3, 7, 9, 1, 4, 8, 2, 6, 4, 2], box=[3, 7, 9, 1, 4, 8, 2, 6, 4, 2]),
dict(id=5, name="Margret Marmajuke", line=[1, 3, 1, 3, 3, 1, 1, 3, 1, 3], bar=[1, 3, 1, 3, 3, 1, 1, 3, 1, 3], tristate=[1, -3, 1, 3, -3, 1, -1, 3, 1, 3], box=[1, 3, 1, 3, 3, 1, 1, 3, 1, 3]),
dict(id=6, name="Frank Harbours", line=[20, 17, 15, 11, 16, 9, 12, 14, 20, 12], bar=[20, 17, 15, 11, 16, 9, 12, 14, 20, 12], tristate=[20, 17, 15, 11, 16, -9, 12, 14, 20, 12], box=[20, 17, 15, 11, 16, 9, 12, 14, 20, 12]),
dict(id=7, name="Jamie Newhart", line=[11, 7, 6, 12, 14, 13, 11, 10, 9, 6], bar=[11, 7, 6, 12, 14, 13, 11, 10, 9, 6], tristate=[11, 7, 6, -12, 1-13, 11, 10, 9, 6], box=[11, 7, 6, 12, 14, 13, 11, 10, 9, 6]),
dict(id=8, name="Gemma Jane", line=[4, 17, 11, 12, 0, 5, 12, 14, 18, 11], bar=[4, 17, 11, 12, 0, 5, 12, 14, 18, 11], tristate=[4, 17, 11, -12, 0, 5, 12, -14, 18, 11], box=[4, 17, 11, 12, 0, 5, 12, 14, 18, 11]),
dict(id=9, name="Emily Sykes", line=[11, 15, 19, 20, 17, 16, 16, 5, 3, 2], bar=[11, 15, 19, 20, 17, 16, 16, 5, 3, 2], tristate=[11, 15, 19, -20, 17, 16, 16, -5, 3, 2], box=[11, 15, 19, 20, 17, 16, 16, 5, 3, 2]),
dict(id=10, name="James Newman", line=[1, 2, 3, 4, 5, 4, 2, 5, 9, 8], bar=[1, 2, 3, 4, 5, 4, 2, 5, 9, 8], tristate=[1, 2, 0, -4, -5, -4, 2, 5, 9, 8], box=[1, 2, 3, 4, 5, 4, 2, 5, 9, 8]),
]
sparkData = pd.DataFrame(sparkData)
sparkData['Bar'] = sparkData['bar'].apply(create_line)
# Now you can use the 'Image' column in your Tabulator table
table = pn.widgets.Tabulator(sparkData, formatters={
'Bar': {
'type': 'image'
}
})
pn.Column(
table
).servable()