Hi,
I’ve been trying to add a second widget to a heatmap plot - a discrete slider that will allow to set the maximum value of the clim where I’m using the convenience of the groupby parameter to also create a widget to select the subset of data.
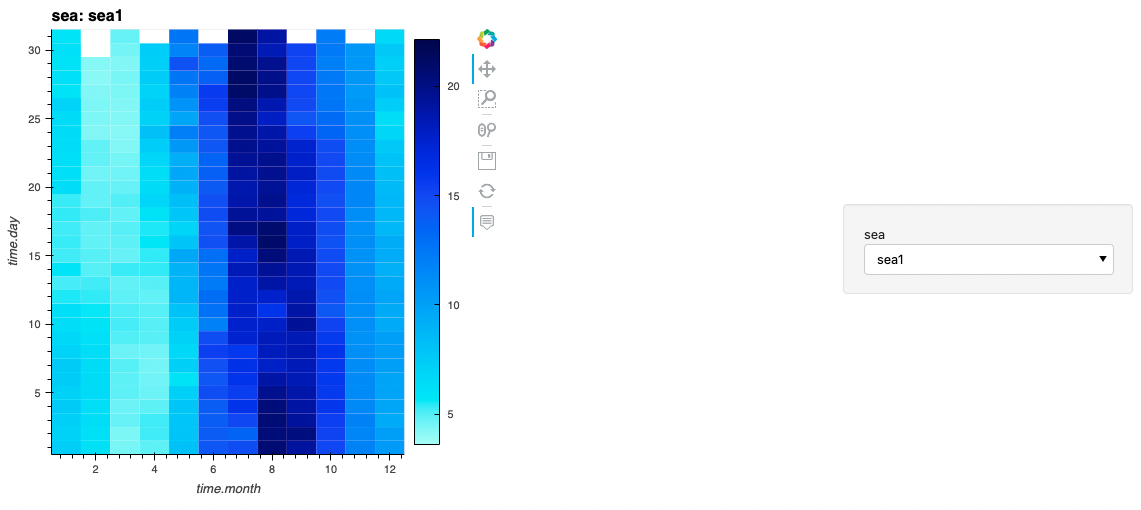
For example below gives me the base plot I’d like:
import pandas as pd
import hvplot.pandas
import numpy as np
import panel as pn
from bokeh.sampledata import sea_surface_temperature as sst

df = sst.sea_surface_temperature

df['sea'] = 'sea1'

df2 = df.copy()
df2['sea'] = 'sea2'
df2_temps = df2['temperature'].to_numpy()
rng = np.random.default_rng()
rng.shuffle(df2_temps)
df2['temperature'] = df2_temps

df_plot = pd.concat([df, df2])

plot = df_plot.hvplot.heatmap(x='time.month', y='time.day', C='temperature',
                       height=500, width=500, groupby=['sea'])
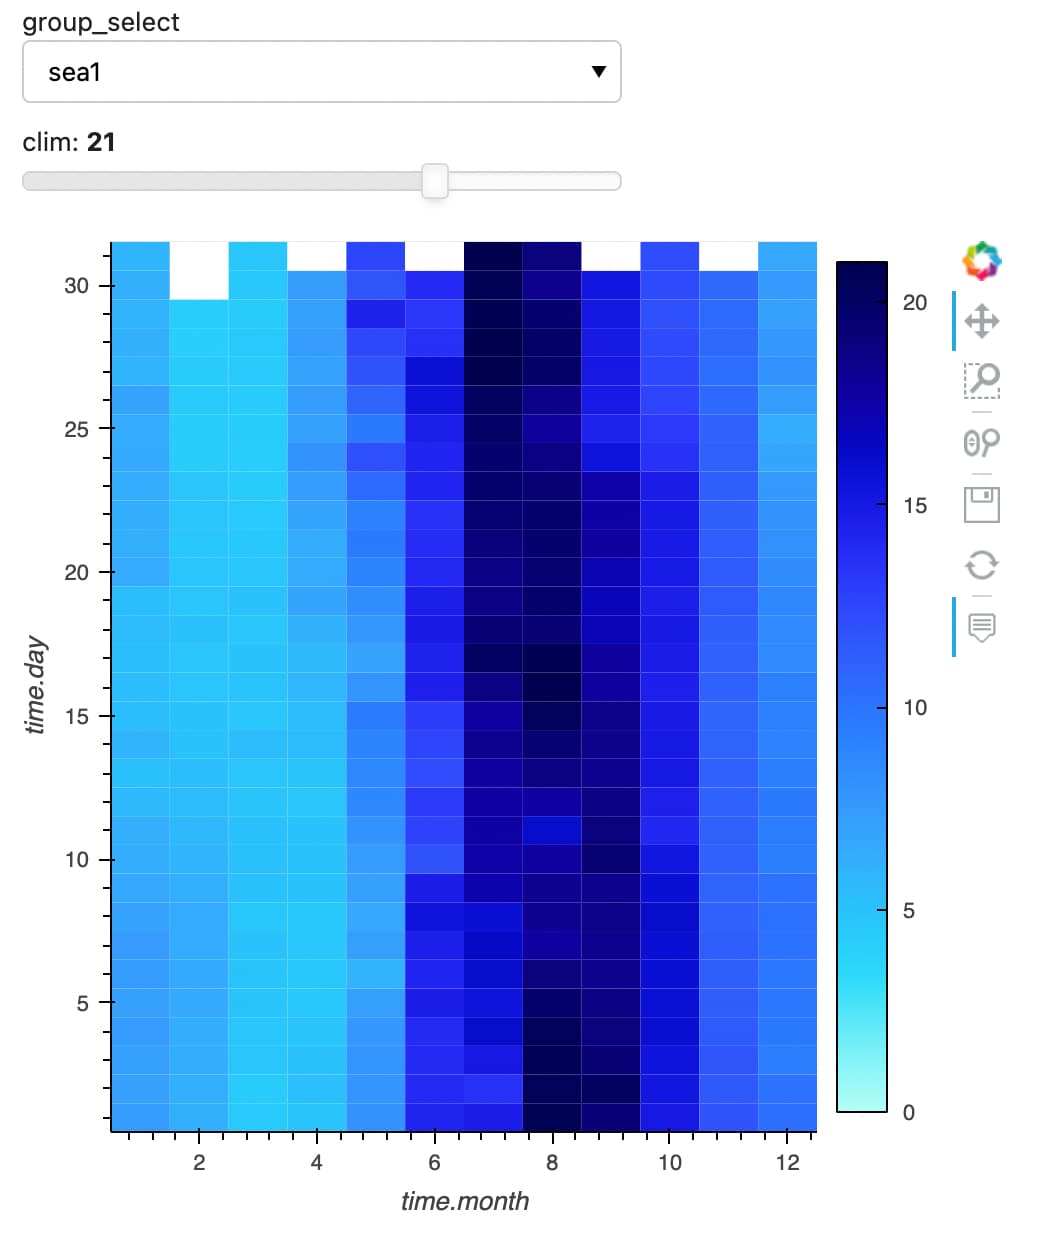
I would then like to add a DiscreteSlider such as:
max_clim = pn.widgets.DiscreteSlider(name='clim', value=20, options=list(range(1, 21)))
in order to set the color scale max as in:
df_plot.hvplot.heatmap(x='time.month', y='time.day', C='temperature',
                       height=500, width=500, groupby=['sea'], clim=(0, max_clim))
I’ve tried various forms of the information here: Widgets — hvPlot 0.8.2 documentation to make the connection including a callback function but I just cannot get it to work.
I can add the widget to the widget box and things like that but I have a feeling I’m misunderstanding something in how the groupby widget and connection is made behind the scenes when using the groupby option. Is it possible to ‘add’ a widget in this situation?