Hi!
I am writing a Panel application that visualizes lightning points in time/space. The top axis is a time/altitude timeseries. The bottom left is a lat/lon map. On each edge of the map, there is a cross section of the points with altitude (one north-south, one east-west), and in the corner of the map, there’s a histogram of the point with height. I’ve written code that gets this working fairly well, which I’ve attached below, and here’s a video of me panning/zooming around through the points: https://youtube.com/shorts/zllB1Shd7gw?feature=share
Original code
from pyxlma.lmalib.io import read as lma_read
from pyxlma.plot.xlma_plot_feature import color_by_time
import xarray as xr
import numpy as np
from bokeh.plotting import figure, show
from bokeh.models import Range1d
import pandas as pd
import hvplot.pandas
import holoviews as hv
import panel as pn

px_scale = 7
plan_edge_length = 60
hist_edge_length = 20

def hook_xlabel_rotate(plot, element):
    plot.state.xaxis.major_label_orientation = -np.pi/2

# ds is an xarray dataset
ds, start_time = lma_read.dataset('LYLOUT_230615_200000_0600.dat.gz')

ds = ds.assign_coords({'number_of_events' : ds.number_of_events.values})
df = pd.DataFrame({
    'lon' : ds.event_longitude.values,
    'lat' : ds.event_latitude.values,
    'alt' : ds.event_altitude.values,
    'time' : ds.event_time.values,
    'timefloats' : color_by_time(ds.event_time.values)[-1] # This gives me float values scaled properly for times
})

xlim = (ds.network_center_longitude.data - 5, ds.network_center_longitude.data + 5)
ylim = (ds.network_center_latitude.data - 1, ds.network_center_latitude.data + 1)
zlim = (0, 20000)

plan_ax = df.hvplot.points(x='lon', y='lat', c='timefloats', cmap='rainbow', rasterize=True, colorbar=False, xlim=xlim, ylim=ylim, width=px_scale*plan_edge_length, height=px_scale*plan_edge_length, responsive=False)
lon_alt_ax = df.hvplot.points(x='lon', y='alt', c='timefloats', cmap='rainbow', rasterize=True, colorbar=False, xlim=xlim, ylim=zlim, width=px_scale*plan_edge_length, height=px_scale*hist_edge_length, responsive=False)
lat_alt_ax = df.hvplot.points(x='alt', y='lat', c='timefloats', cmap='rainbow', rasterize=True, colorbar=False, ylim=ylim, xlim=zlim, width=px_scale*hist_edge_length, height=px_scale*plan_edge_length, responsive=False).opts(hooks=[hook_xlabel_rotate])
hist_ax = df.hvplot.hist(y='alt', bin_range=zlim, bins=20, invert=True, rasterize=True, xlabel='alt', ylabel='src', width=px_scale*hist_edge_length, height=px_scale*hist_edge_length, responsive=False).opts(hooks=[hook_xlabel_rotate])
alt_time = df.hvplot.points(x='time', y='alt', c='timefloats', cmap='rainbow', rasterize=True, colorbar=False, ylim=zlim, width=px_scale*(plan_edge_length+hist_edge_length), height=px_scale*hist_edge_length, responsive=False)

the_lower_part = (lon_alt_ax + hist_ax + plan_ax + lat_alt_ax).cols(2)


title = pn.pane.Markdown('## LMA Data Explorer')

pn.Column(title, alt_time, the_lower_part).servable()
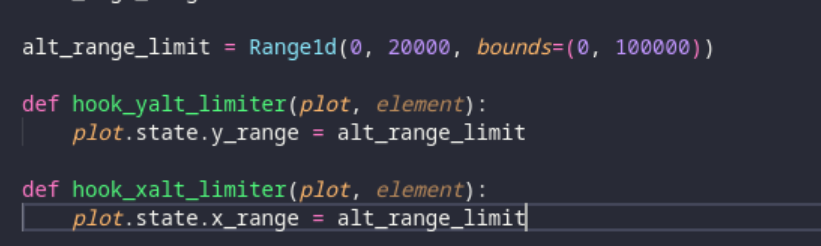
There are no lightning sources below the ground, and usually the points above 100km are irrelevant to forecasters. As such, I’d like to prevent scrolling in the altitude direction beyond these bounds. I did this by using hooks to apply bounds to the underlying bokeh objects:
Code with bounds
from pyxlma.lmalib.io import read as lma_read
from pyxlma.plot.xlma_plot_feature import color_by_time
import xarray as xr
import numpy as np
from bokeh.plotting import figure, show
from bokeh.models import Range1d
import pandas as pd
import hvplot.pandas
import holoviews as hv
import panel as pn

px_scale = 7
plan_edge_length = 60
hist_edge_length = 20

def hook_yalt_limiter(plot, element):
    plot.state.y_range = Range1d(0, 20000, bounds=(0, 100000))

def hook_xalt_limiter(plot, element):
    plot.state.x_range = Range1d(0, 20000, bounds=(0, 100000))

def hook_xlabel_rotate(plot, element):
    plot.state.xaxis.major_label_orientation = -np.pi/2

# ds is an xarray dataset
ds, start_time = lma_read.dataset('LYLOUT_230615_200000_0600.dat.gz')

ds = ds.assign_coords({'number_of_events' : ds.number_of_events.values})
df = pd.DataFrame({
    'lon' : ds.event_longitude.values,
    'lat' : ds.event_latitude.values,
    'alt' : ds.event_altitude.values,
    'time' : ds.event_time.values,
    'timefloats' : color_by_time(ds.event_time.values)[-1] # This gives me float values scaled properly for times
})

xlim = (ds.network_center_longitude.data - 5, ds.network_center_longitude.data + 5)
ylim = (ds.network_center_latitude.data - 1, ds.network_center_latitude.data + 1)
zlim = (0, 20000)

plan_ax = df.hvplot.points(x='lon', y='lat', c='timefloats', cmap='rainbow', rasterize=True, colorbar=False, xlim=xlim, ylim=ylim, width=px_scale*plan_edge_length, height=px_scale*plan_edge_length, responsive=False)
lon_alt_ax = df.hvplot.points(x='lon', y='alt', c='timefloats', cmap='rainbow', rasterize=True, colorbar=False, xlim=xlim, ylim=zlim, width=px_scale*plan_edge_length, height=px_scale*hist_edge_length, responsive=False).opts(hooks=[hook_yalt_limiter])
lat_alt_ax = df.hvplot.points(x='alt', y='lat', c='timefloats', cmap='rainbow', rasterize=True, colorbar=False, ylim=ylim, xlim=zlim, width=px_scale*hist_edge_length, height=px_scale*plan_edge_length, responsive=False).opts(hooks=[hook_xlabel_rotate, hook_xalt_limiter])
hist_ax = df.hvplot.hist(y='alt', bin_range=zlim, bins=20, invert=True, rasterize=True, xlabel='alt', ylabel='src', width=px_scale*hist_edge_length, height=px_scale*hist_edge_length, responsive=False).opts(hooks=[hook_xlabel_rotate, hook_yalt_limiter])
alt_time = df.hvplot.points(x='time', y='alt', c='timefloats', cmap='rainbow', rasterize=True, colorbar=False, ylim=zlim, width=px_scale*(plan_edge_length+hist_edge_length), height=px_scale*hist_edge_length, responsive=False).opts(hooks=[hook_yalt_limiter])

the_lower_part = (lon_alt_ax + hist_ax + plan_ax + lat_alt_ax).cols(2)


title = pn.pane.Markdown('## LMA Data Explorer')

pn.Column(title, alt_time, the_lower_part).servable()
However, now when I zoom around, the altitudes on the other axes don’t update… Is there a way to explicitly link these axes together again?
Thanks for any assistance!