I’m in a situation where adding a simple scatter plot to my panel column makes it impossible to render another graph that is a network.
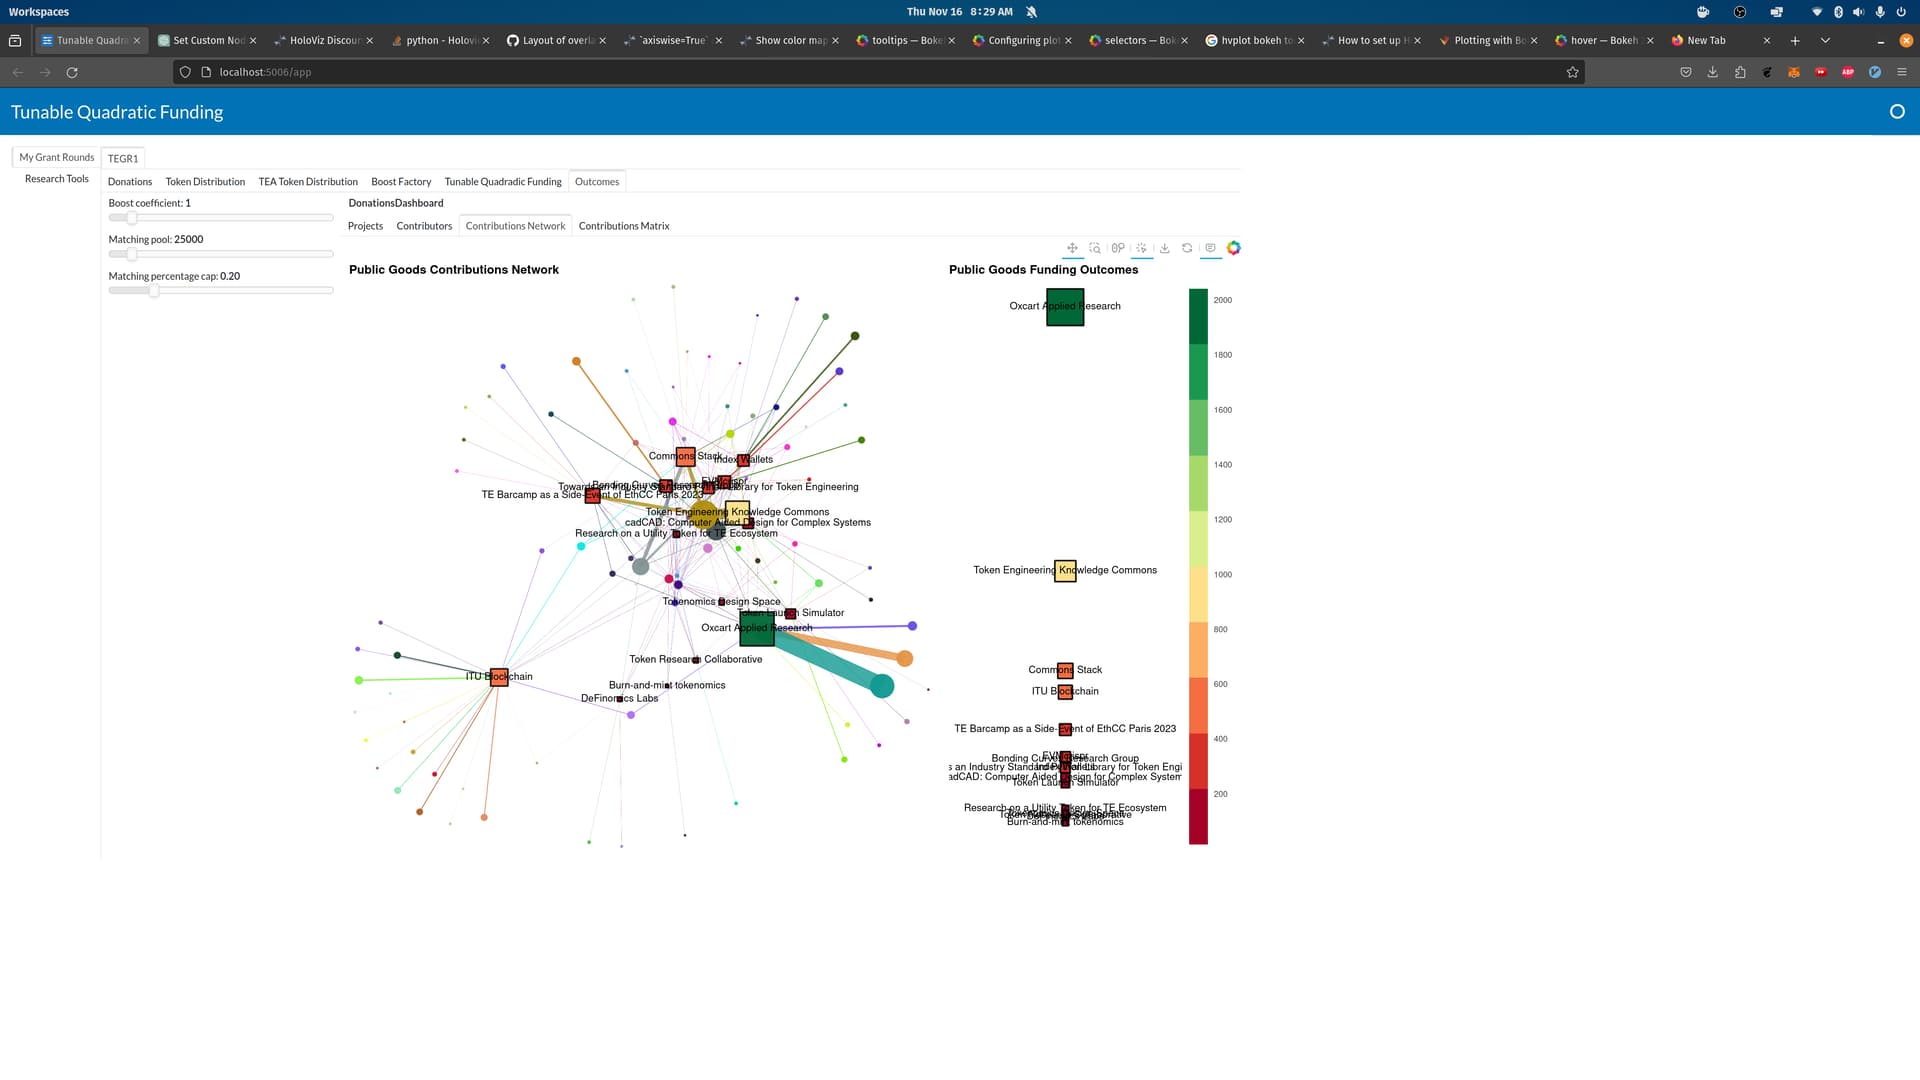
With just the network:
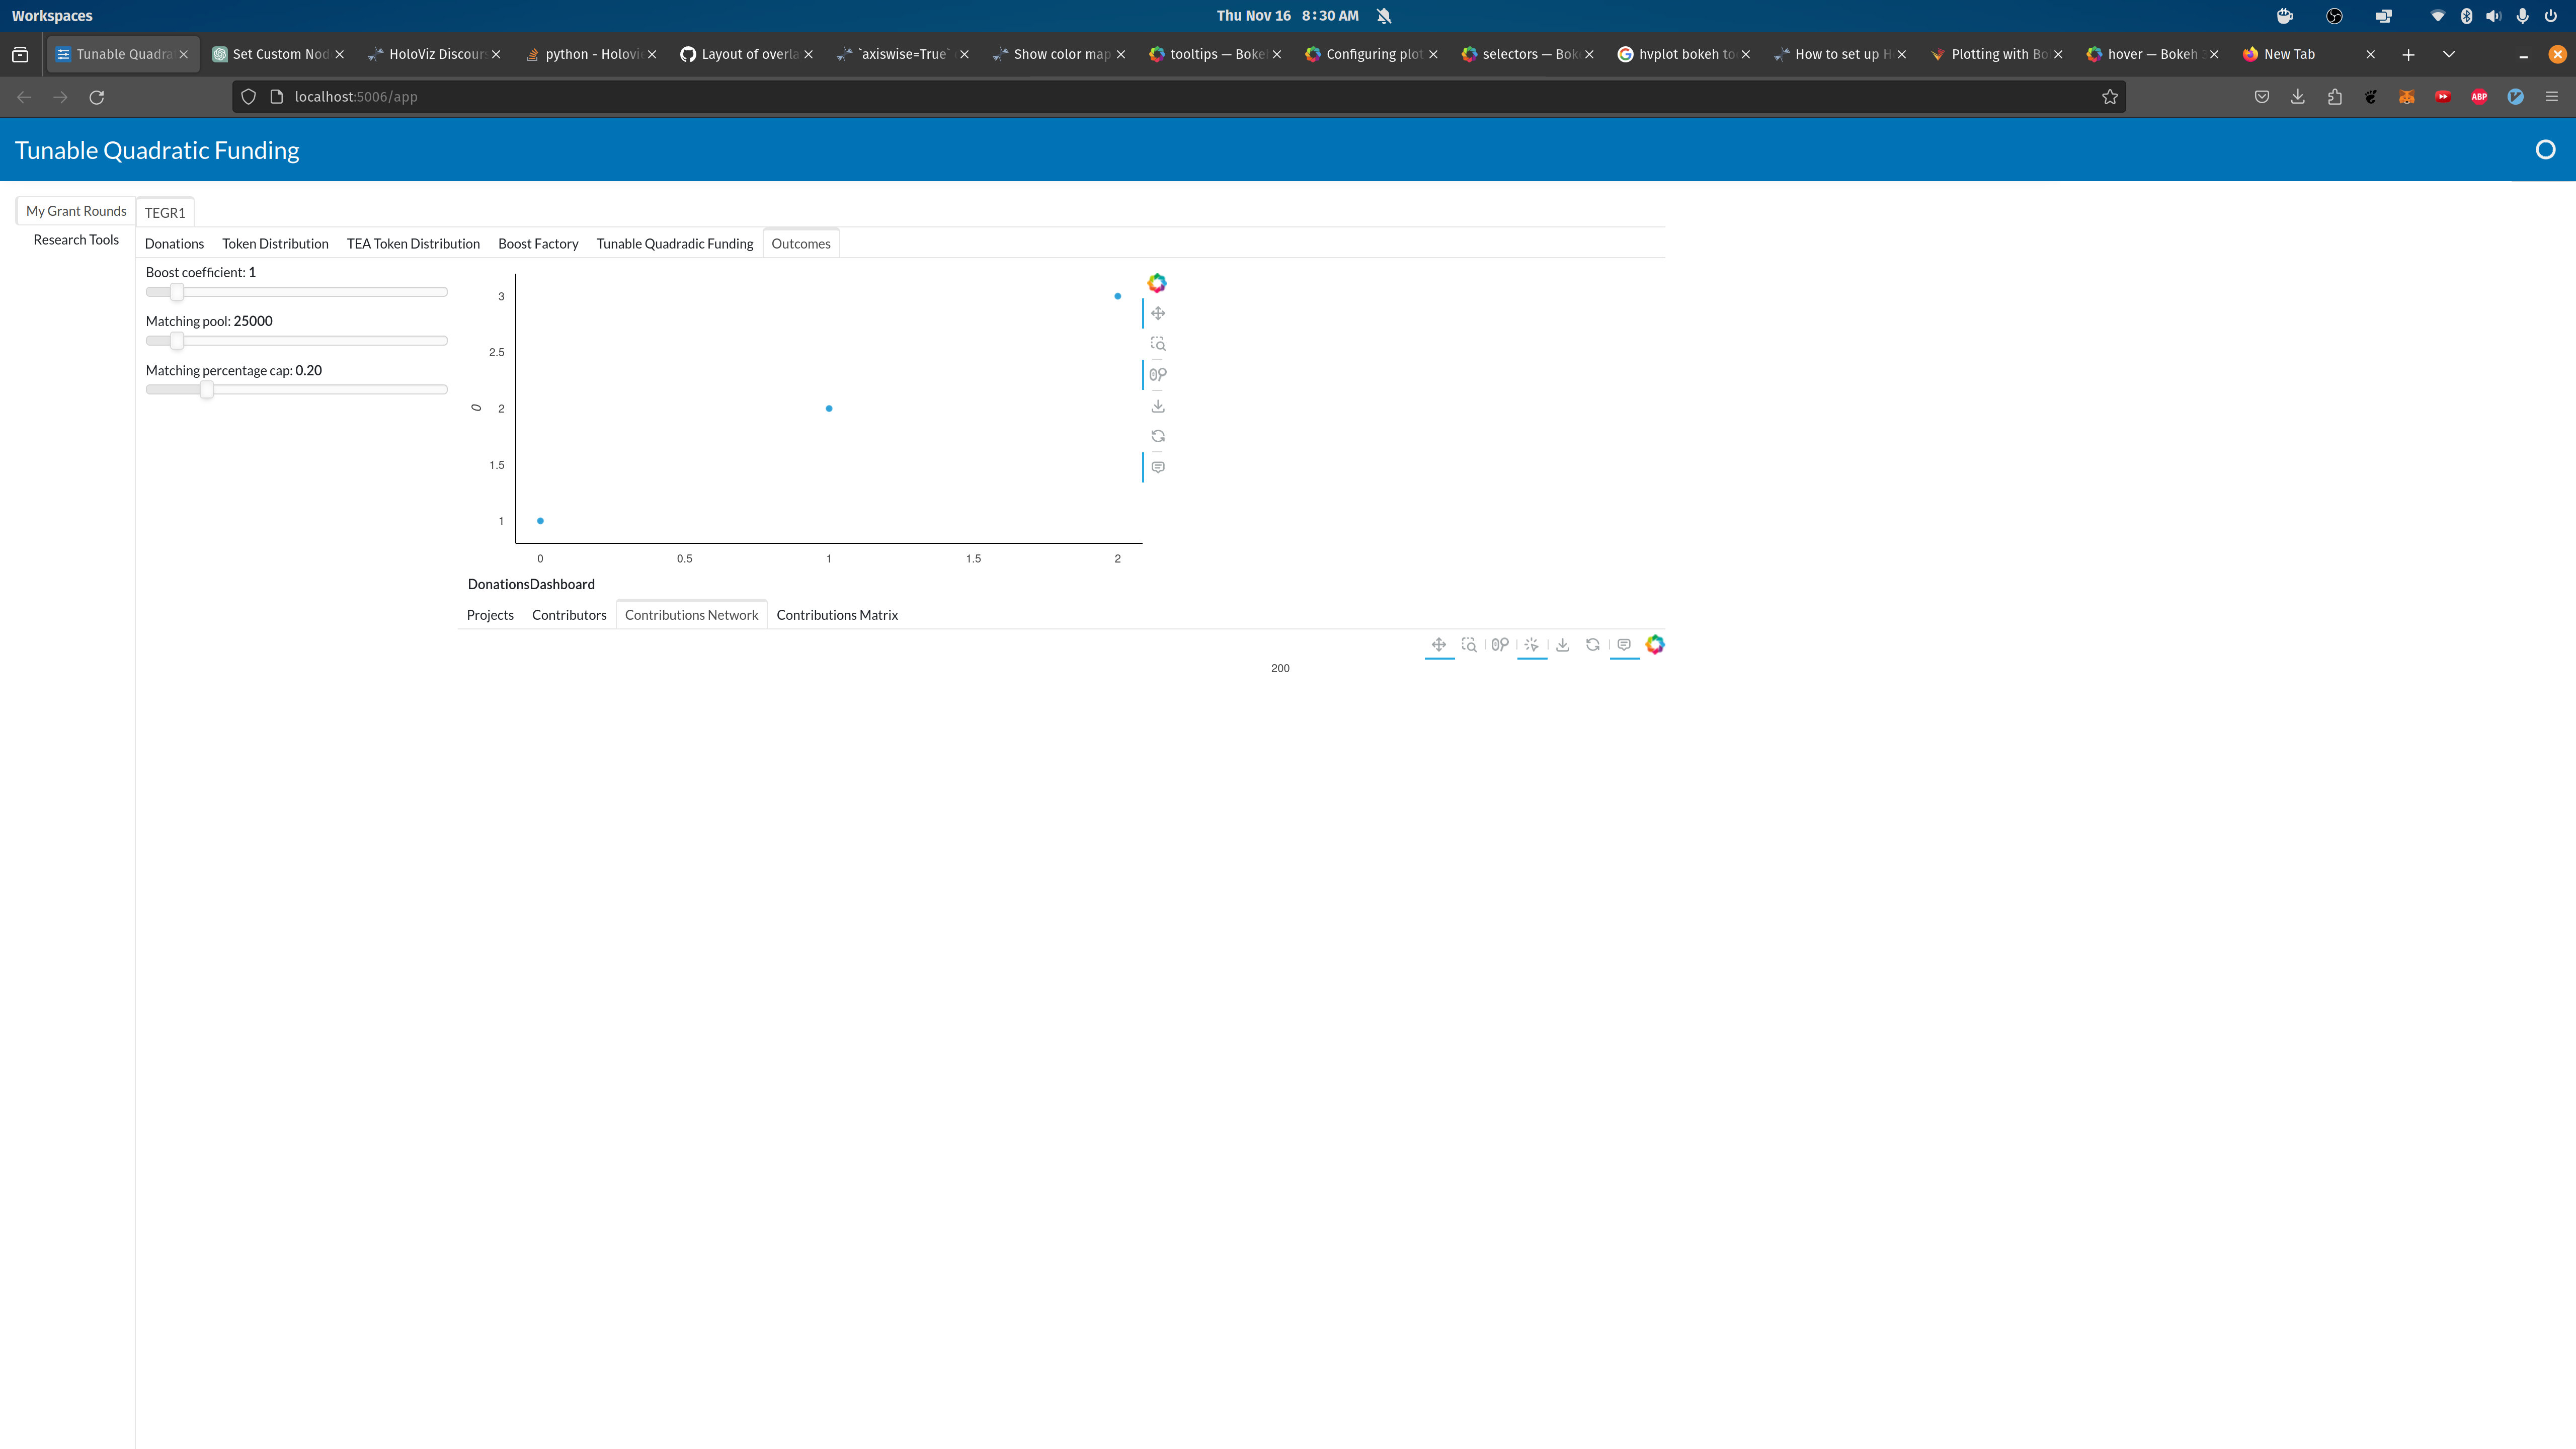
With scatter plot and network in column:
The code can be found here: https://github.com/CommonsBuild/alloha/blob/49a58115a1aa1a3375d829b7c3a91e9c3e92b61c/app/tqf/outcomes.py#L26
I’m temporarily working around the issue by putting the different plots into different tabs.
Hi @LinuxIsCool
I looked at the file. But it does not look like a minimum, reproducible example I can quickly start experimenting with. Could you share a minimum, reproducible example? That would be cool ?.