Hello everyone,
I’m new to holoviz, and still have to learn a lot. It might just be that I couldn’t find the right resource to my questions. So maybe you could point me in the right direction.
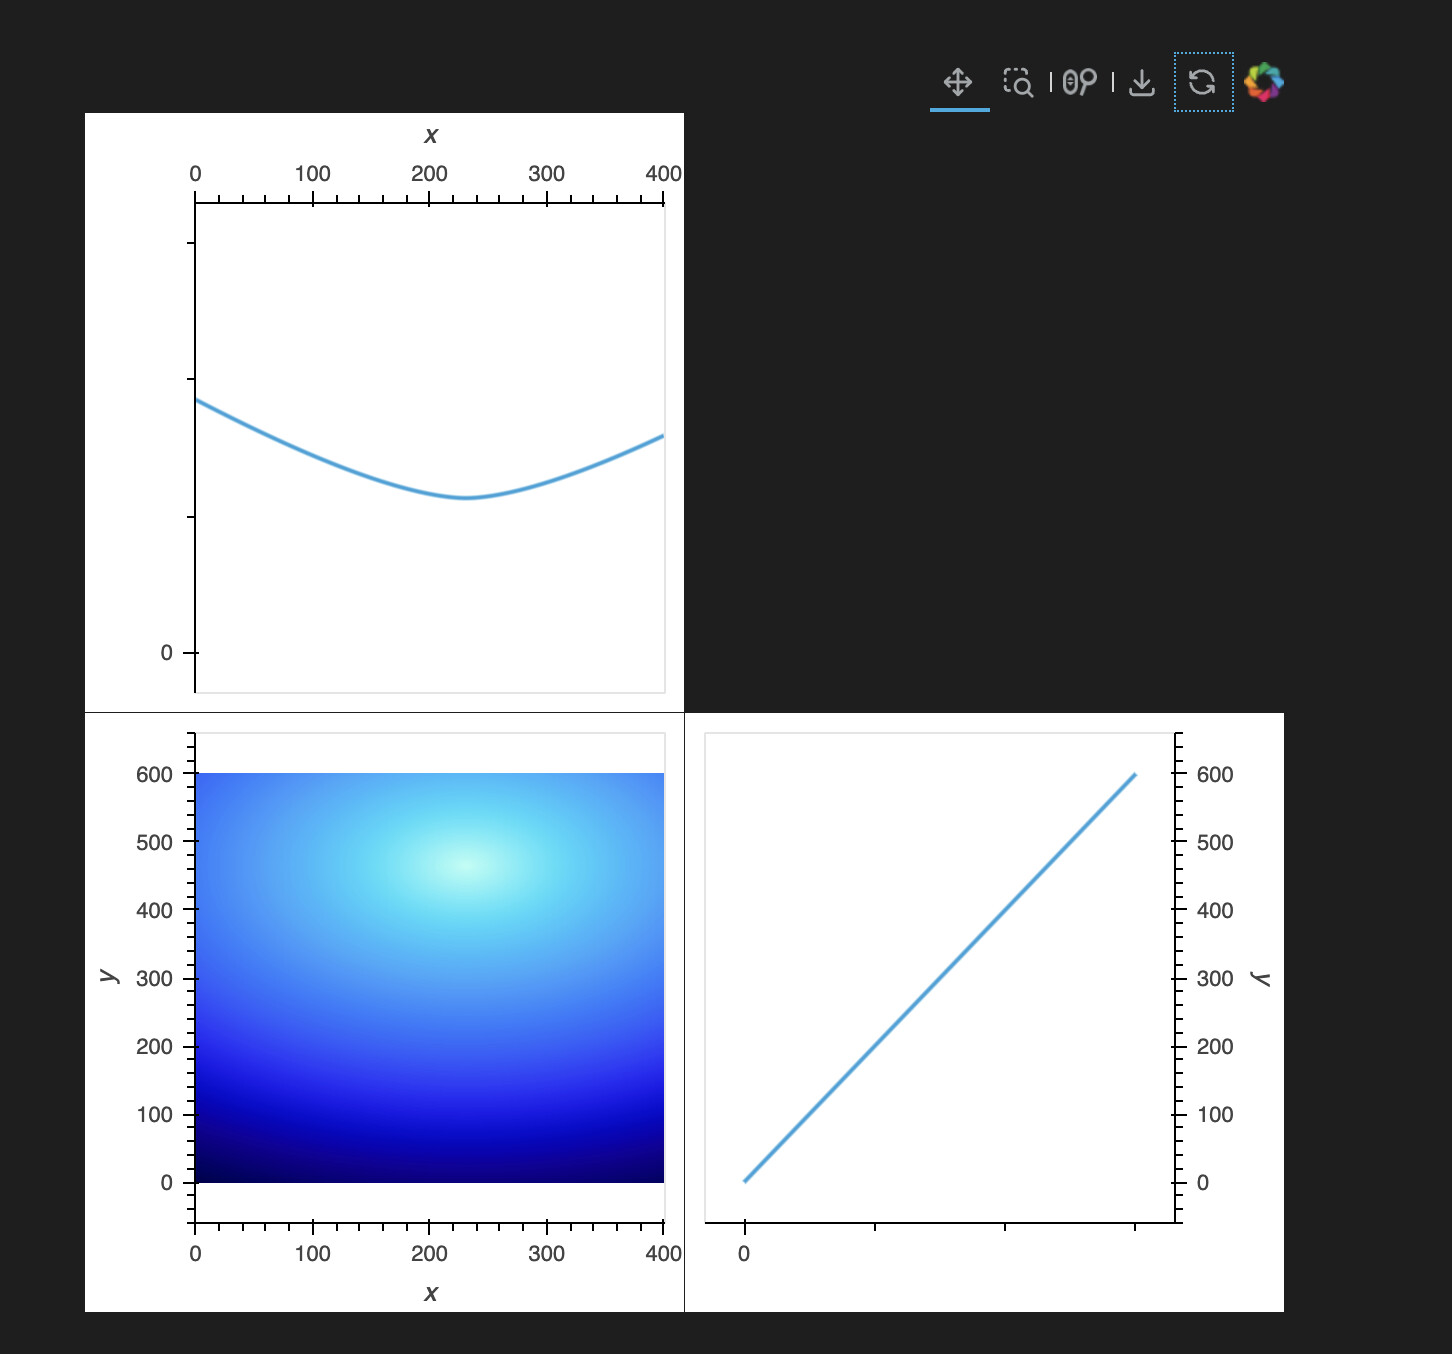
First, I’m trying to visualize image-like data (uniformly spaced Griddata) with the intensity projections onto both axes. For this I’m using the adjoint layout, similar to the Bounds & selection stream example but with an image as main, not a scatter.
Unfortunately, I figured out that hv.operation.histogram is not the right method to do this, and ended up with adding the projections as curves.
Here is my MWE:
x = np.arange(401)
y = np.arange(601)
X, Y = np.meshgrid(x,y)
x_c = 231
y_c = 465

z = np.sqrt( (X - x_c)**2 + (Y - y_c)**2 )
z /= z.max()

img_hv = hv.Image((x, y, z), extents=(0, 0, 401, 601))
element_y_proj = hv.Curve((y, z.sum(axis=1)))
element_x_proj = hv.Curve((x, z.sum(axis=0)))
layout = img_hv << element_y_proj << element_x_proj
layout
However, there are several things I would like to change.
- The resulting image and the top curve plot range from 0 to 600 in x, not to 400. This leads to a big white blob next to the actual image.
- The labels appear twice, on the image plot and on the curve plots. Following this post I was able to fix this according to the options by removing the axis. But I would like to change the labels as well. Especially because the one for the vertical axis also reads ‘x’ even though this must be at least ‘y’. For the standalone image plot I learned that it could be done with
.redim.label(x='x /px', y='y /px'). But on the layout, and its properties, it does not work. - There is also one caveat with the interactive beahavior. I started with the matplotlib backend first due to limitations in VSCode, but after updating to the latest packages, bokeh also works there more or less. But the interactive panning of the right subplot moves in the wrong direction. When panning upwards in the image, the right curve plot is moving downwards. Ideally, I would also prefer to restrict the panning on the curve plots only in horizontal for the top, and vertically for the right curve plot, but I have to admit that I did not search for this yet. I think I stumbled upon the settings for panning a while ago, so I guess for this bullet point I should first spend some time on it on my own.
As I said, I tried to search a lot and browsed through the resources, but couldn’t fix it by myself. Maybe it’s just enough to point me in the right direction. Thank you very much for your help!
And in general, thanks for the great work on holoviz!