I’m using a Datashader through hvplot to display about 1M scatter points. I’ve set the WheelZoomTool and PanTool to only interact with the width dimension (X axis). As I zoom and slide along the X axis I would like the Y axis range to adjust to the data currently visible.
I’ve seen a few other requests for help with this:
Obviously a javascript approach doesn’t make sense for Datashader.
The hooks approach almost works, but in some cases Datashader didn’t include some of the data that was past a previous ylim in the newly ranged chart.
Here’s where I’m at. I’m a beginner at HoloViews and would really appreciate some advice on ways to accomplish this better.
plot = originalData.price.hvplot.scatter(datashade=True, dynspread=True)

x_range = hv.streams.RangeX(x_range=plot.range(0))
def limitPointsToRange(points, x_range):
    # Not sure how to perform min/max on these points
    # pointsInRange = points.select(time=x_range)

    # Instead just look at the original data the plot was created on
    pointsInRange = originalData.price.loc[x_range[0]:x_range[1]]
    min = pointsInRange.min()
    max = pointsInRange.max()
    return points.opts(hooks=[
        lambda plot, _: plot.handles['y_range'].update(start=min, end=max)
    ], ylim=(min, max))

plot.apply(limitPointsToRange, streams=[x_range])
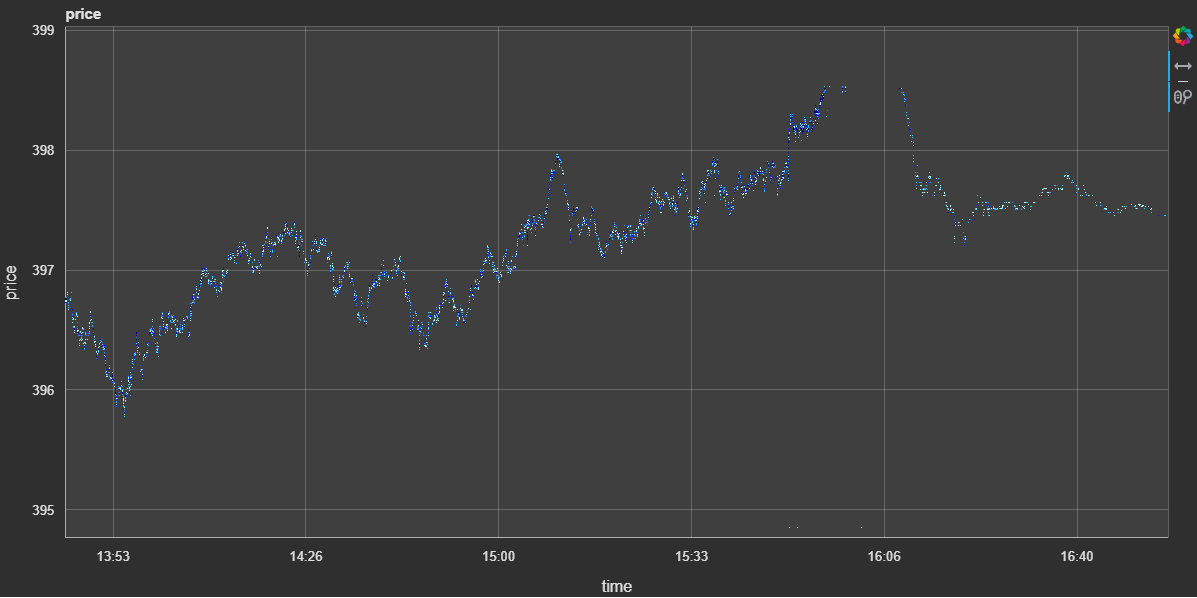
Here’s an example where I zoomed out and Datashader didn’t include some of the data in the raster before the range was set (around 16:00):