Thanks all (I can only tag two people in a post right now) for your feedback and suggestions! While playing some more with the alignment and other properties you suggested, I came across the clone property and realized that part of the problem was that as I tried various sizing options they were being stored with the object and thus continuing to affect my output. Once I added clone=True I was able to troubleshoot more easily.
My ultimate solution to get things lined up the way I wanted was to create an intermediate object that combined dem and berglines and allowed me to specify a combined width for both of them. So my code is updated to:
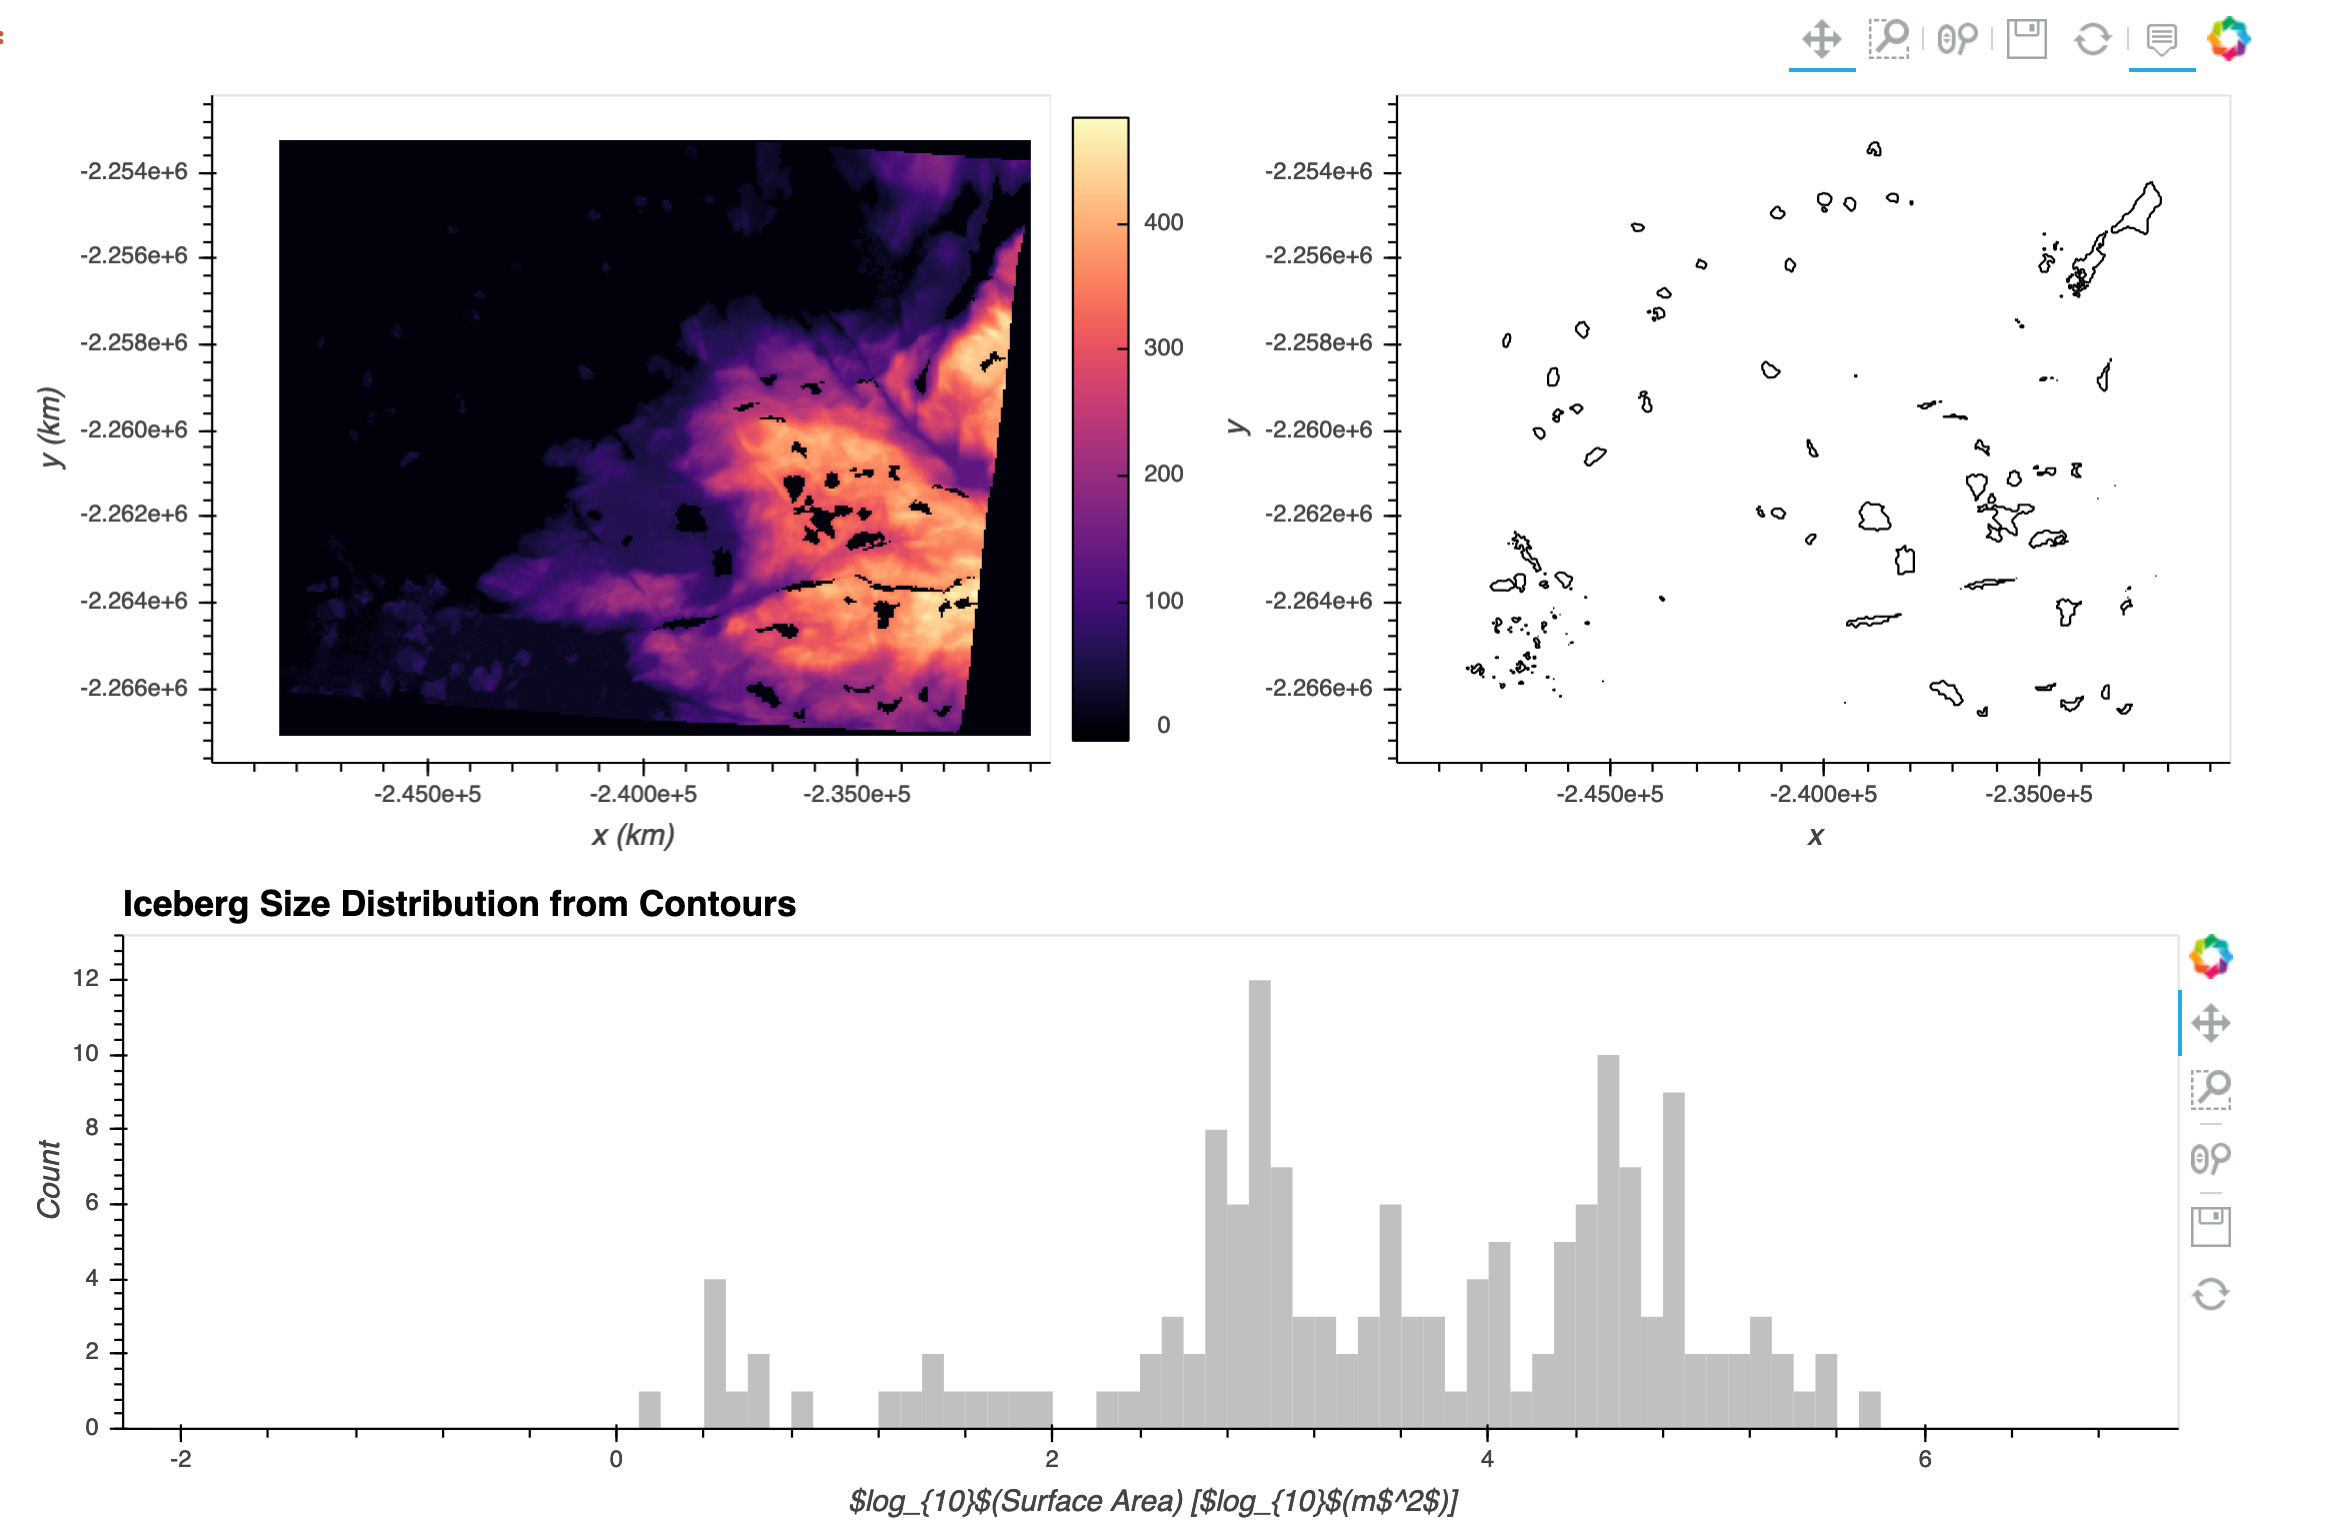
# top left plot
dem = data.hvplot.image(rasterize=True, aspect="equal", cmap='magma',
                       xlabel="x (km)", ylabel="y (km)")

# top right plot
berglines = hv.Contours(bergs)
berglines.opts(aspect="equal", color='k')

# top row
bergsr = dem + berglines

# bottom plot
freq, bins = np.histogram(np.log10(areas), np.arange(-2,7,0.1))
bergszdist = hv.Histogram((freq,bins))
bergszdist.opts(xlabel='$log_{10}$(Surface Area) [$log_{10}$(m$^2$)]', ylabel='Count',
                title='Iceberg Size Distribution from Contours',
               fill_color='silver', line_width=0)

# panel figure with all three plots
pnfig = pn.Column(
    pn.Row(
        bergsr.opts(width=1000, clone=True),
    bergszdist.opts(width=1000, shared_axes=False, clone=True))