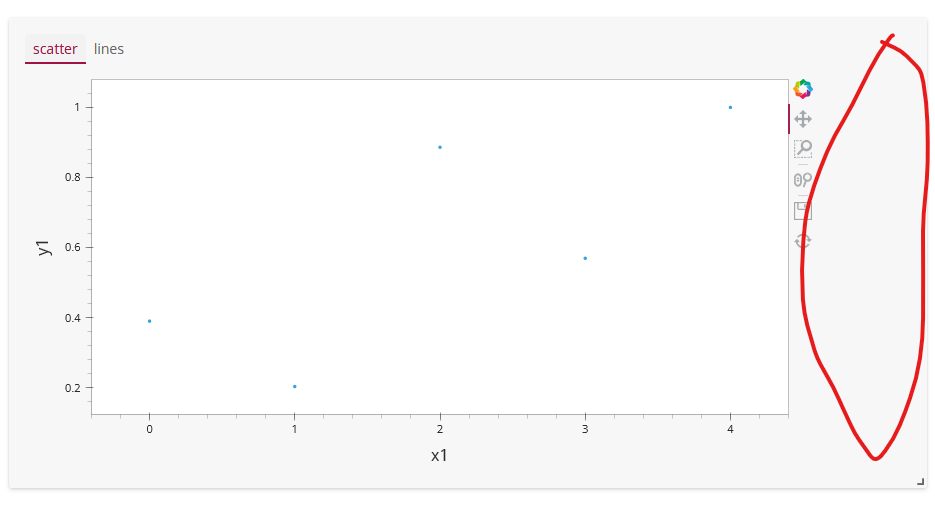
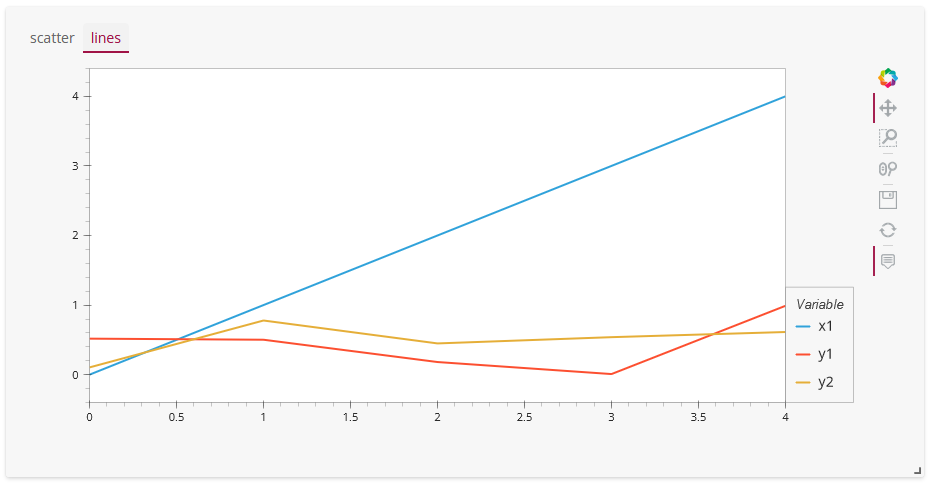
I have multiple holoviews graphs in different pn.Tabs. They have different sizes, because the second has a a legend and the first not, but they align themselves with eachother. I’d like to turn this alignment off because I now end up with a lot of whitespace in the first tab.
How can I do this? I thought this was controlled with linked_axes=False but that didn’t fix it:
sct_pane = pn.pane.HoloViews(sct, linked_axes=False)
line_pane = pn.pane.HoloViews(lines, linked_axes=False)
The alignment functionality is great in pn.Columns, but perhaps it should be off by default in Tabs since you anyways cannot see the graphs at the same time?
MWE:
import panel as pn
import holoviews as hv
import pandas as pd
import numpy as np
from hvplot import hvPlotTabular

num = 5
x1 = np.arange(num)
y1 = np.random.rand(num)
y2 = np.random.rand(num)
df = pd.DataFrame({'x1': x1, 'y1': y1, 'y2': y2})


sct = hv.Scatter(df, kdims='x1', vdims='y1').opts(responsive=True)
lines = hvPlotTabular(df).line(width=None, responsive=True).opts(legend_position='right')

sct_pane = pn.pane.HoloViews(sct)
line_pane = pn.pane.HoloViews(lines)
tabs = pn.Tabs(
    ('scatter', sct_pane),
    ('lines', line_pane)
)


# cols = pn.Column(sct_pane, line_pane, sizing_mode='stretch_both')

templ = pn.template.FastGridTemplate()

templ.main[0:3, 0:6] = tabs

templ.servable()
Output (whitespace marked red i’m trying to remove):