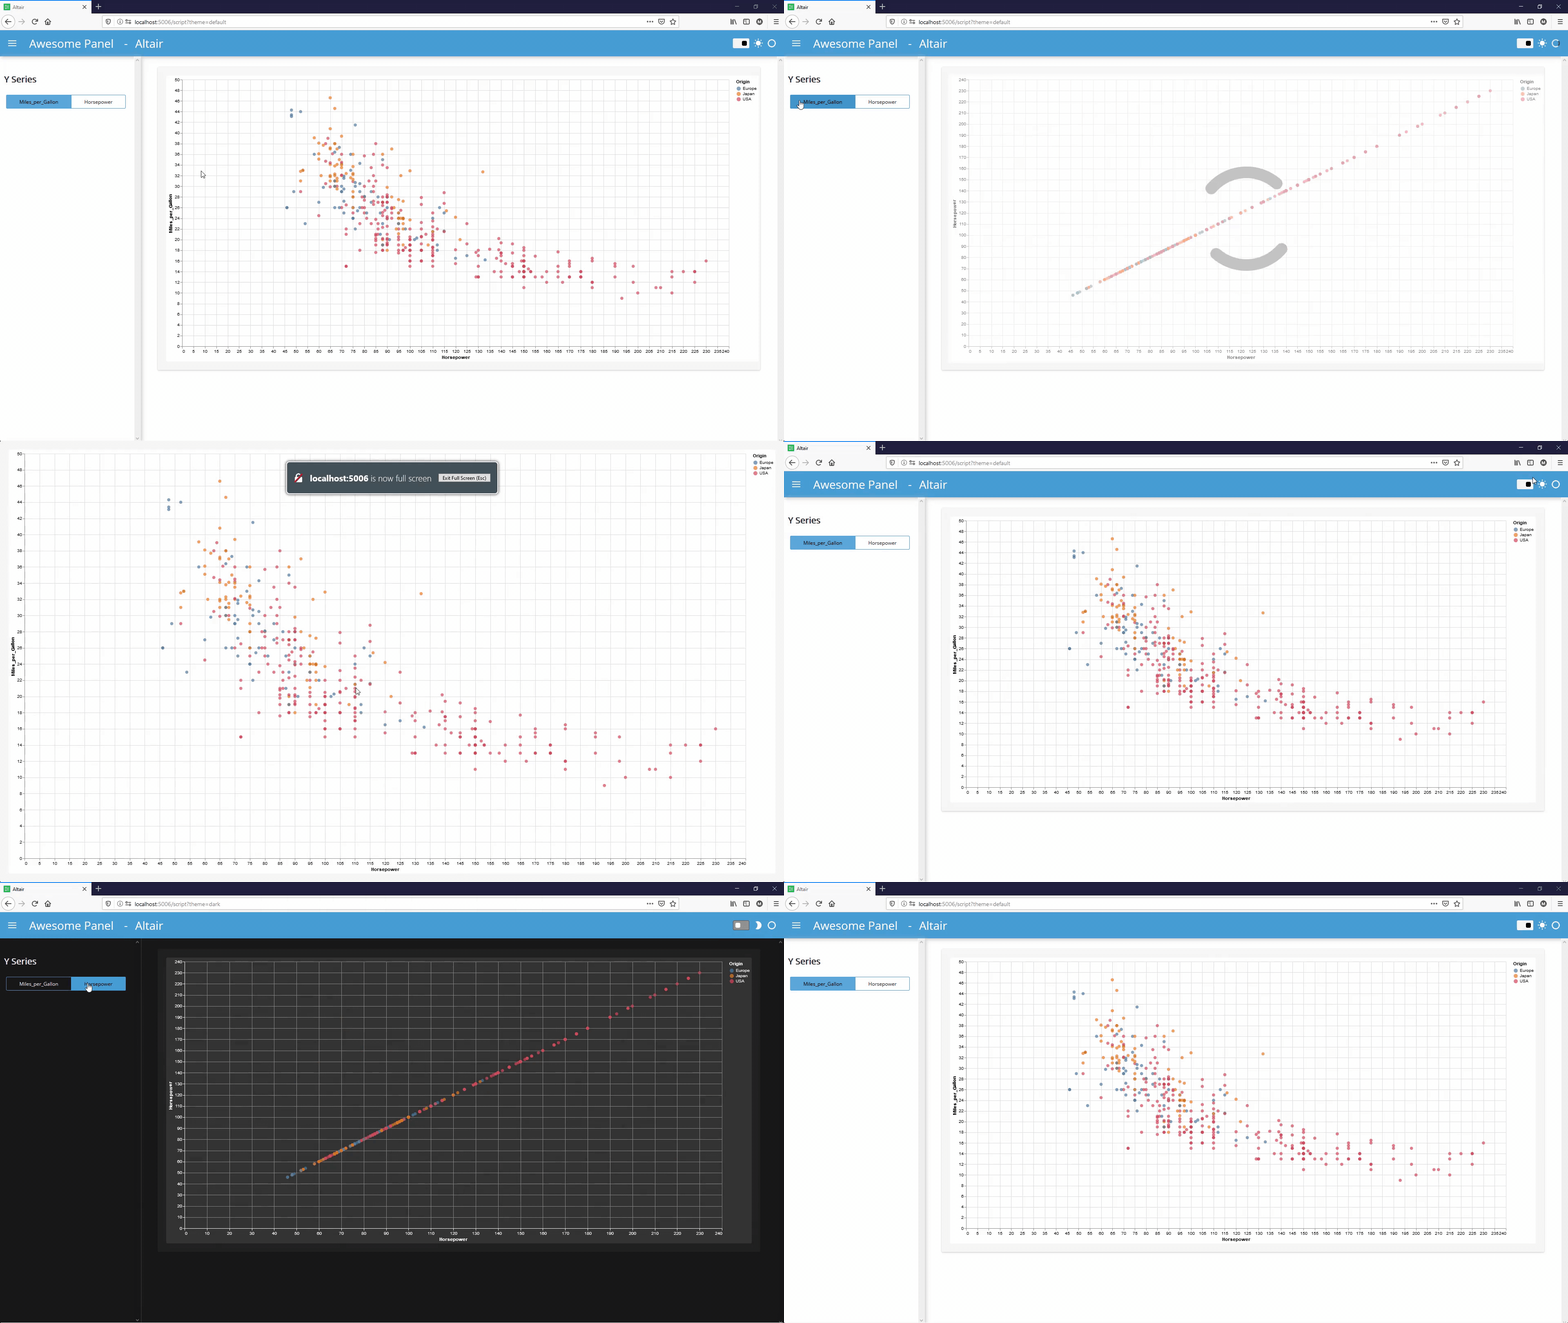
Yesterday I saw a tweet asking which projects supports Altair. That motivated me to create the below example that I hope will can inspire you to get started with Panel and Altair if your are interested.
The example demonstrates how to
- use Altair
- theme your plot
- bind your plot to a widget.
- automatically add a loading indicator
- wrap your plot into a nice template
For more check out
- Panel Vega/ Altair Reference Guide
- Panel Getting Started Guide
- Add event support to Panel Vega/ Altair · Issue #2365.
If you like Panel or this example please share on social media
- Twitter: https://twitter.com/MarcSkovMadsen/status/1428242355698679813?s=20
- LinkedIn: Panel on LinkedIn: #Vega #Altair #python
Install the requirements via pip install panel altair vega_datasets
To serve the example run panel serve name_of_script.py --autoreload in the terminal.
import altair as alt
import panel as pn

from vega_datasets import data

pn.extension("vega", sizing_mode="stretch_width")


def get_plot(theme="default", y_series="Miles_per_Gallon"):
    if theme == "dark":
        alt.themes.enable("dark")
    else:
        alt.themes.enable("default")

    return (
        alt.Chart(data.cars())
        .mark_circle(size=60)
        .encode(
            x="Horsepower",
            y=y_series,
            color="Origin",
            tooltip=["Name", "Origin", "Horsepower", "Miles_per_Gallon"],
        )
        .properties(
            height="container",
            width="container",
        )
        .interactive()
    )


accent_base_color = ["#00A170", "#DAA520", "#2F4F4F", "#F08080", "#4099da"][-1]  # pick a nice template = pn.template.FastListTemplate(
    site="Awesome Panel",
    title="Altair",
    accent_base_color=accent_base_color,
    header_background=accent_base_color,
    header_accent_base_color="white",
)
theme = "dark" if template.theme == pn.template.DarkTheme else "default"

y_series = pn.widgets.RadioButtonGroup(
    name="y_series",
    value="Miles_per_Gallon",
    options=["Miles_per_Gallon", "Horsepower"],
    button_type="success",
)
plot_interactive = pn.bind(get_plot, theme=theme, y_series=y_series)
component = pn.panel(
    plot_interactive, height=700, sizing_mode="stretch_both", loading_indicator=True
)

template.sidebar.append("## Y Series")
template.sidebar.append(y_series)
template.main.append(component)

template.servable()
