How can i put some text over my plot and not have to fiddle with it to get it at the same screen coordinate location? I only see how to do it in data coordinates.
#data
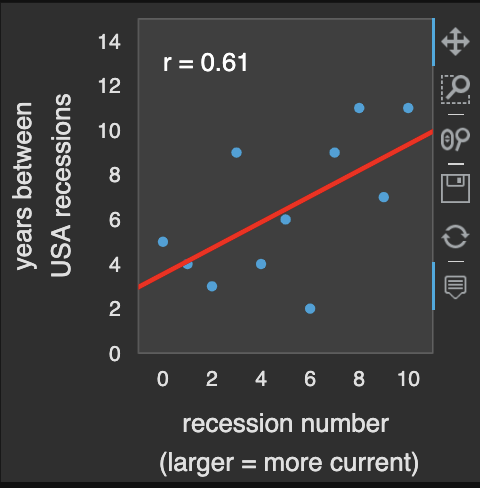
gap = [5,4,3,9,4, 6, 2, 9, 11, 7, 11]
# compute correlation coefficient
r = pd.DataFrame(gap).reset_index().corr().loc['index',0]
# make scatter plot
scat = (pd.DataFrame(gap)
.hvplot.scatter(ylabel='years between\nUSA recessions',
xlabel='recession number\n (larger = more current)',
ylim=(0,15),
height=300, width=300))
# add regression line and correlation coefficient
(hv.Slope.from_scatter(scat)
.opts(color='red')
* scat
* hv.Text(x=0, y=13,
text=f'{r = :.2f}',
halign='left')