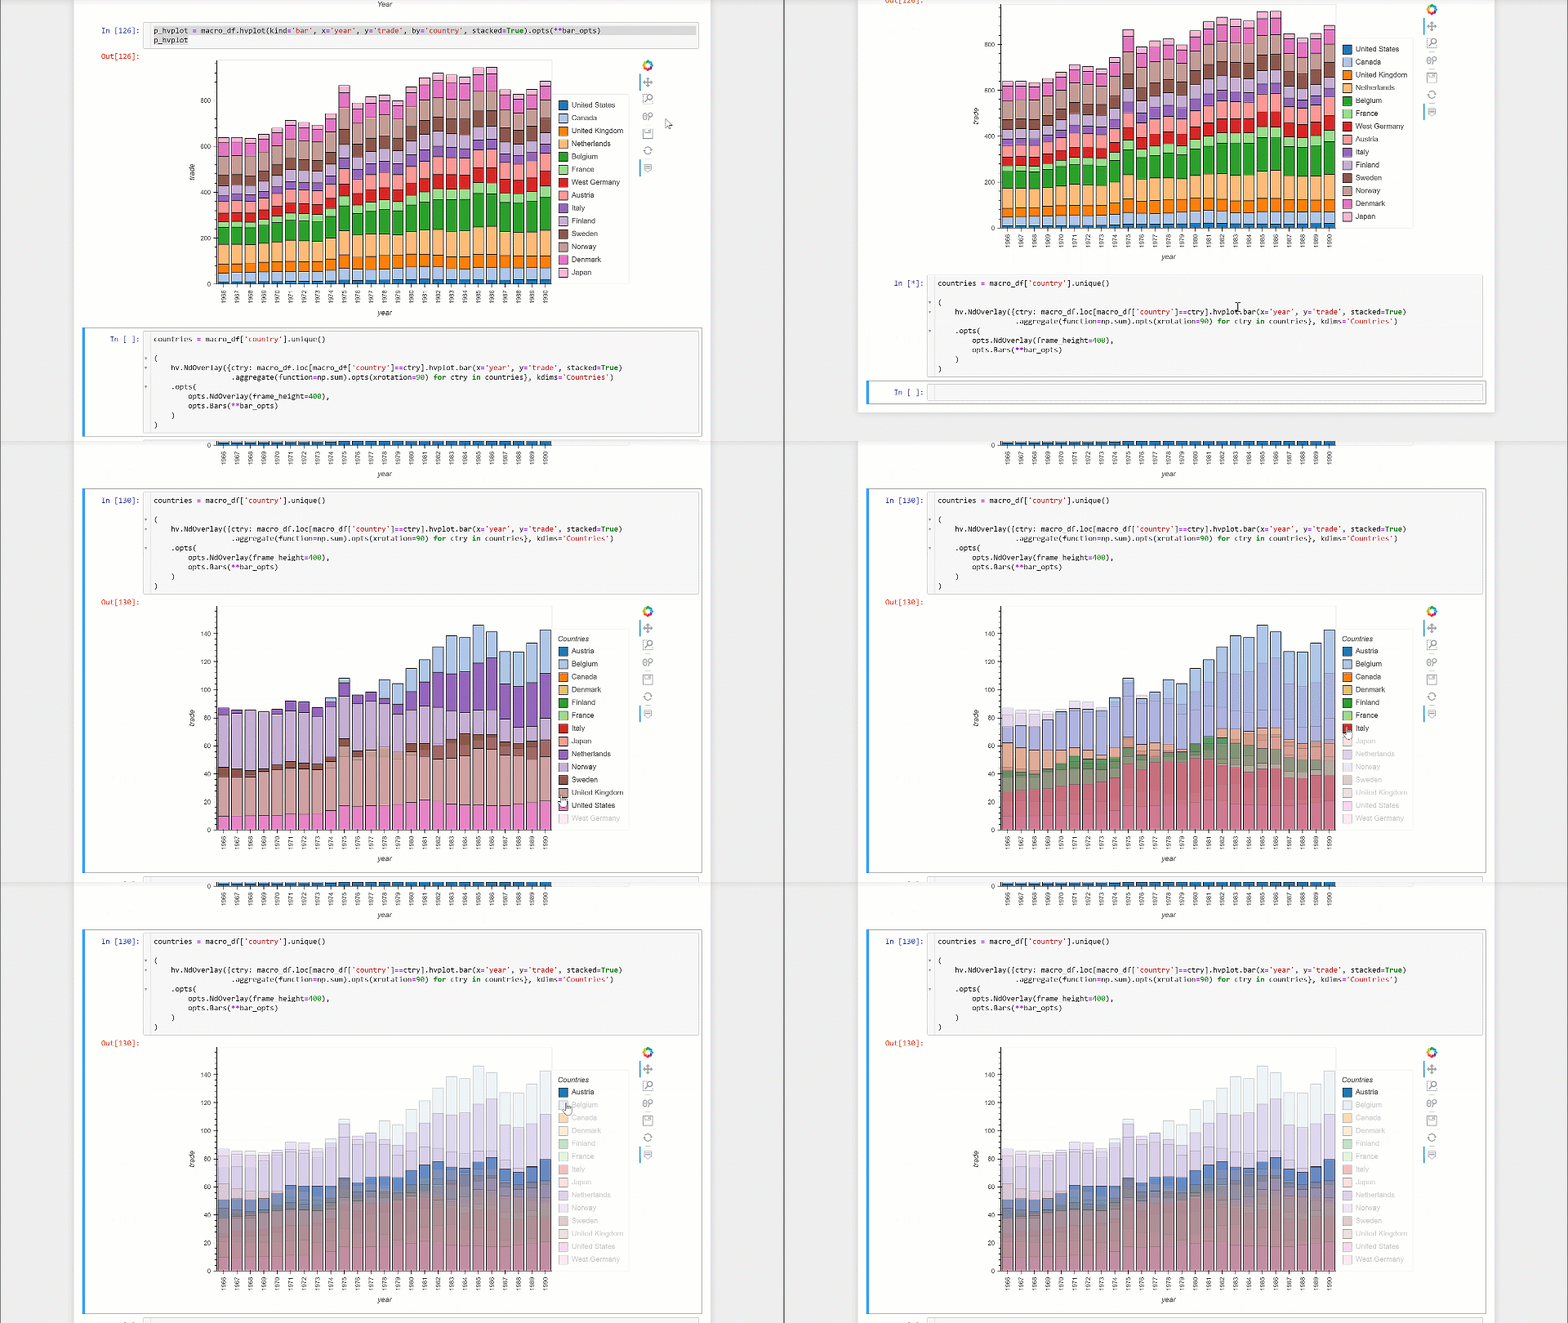
Hi, I am trying to make a stacked bar chart with interactive legend starting with the example in holoviews gallery / bars_economic.
First a some imports and displaying the test-data:
import pandas as pd
import holoviews as hv
from holoviews import opts
import hvplot.pandas
import numpy as np
hv.extension('bokeh','matplotlib')

macro_df = pd.read_csv('http://assets.holoviews.org/macro.csv', '\t')
key_dimensions   = [('year', 'Year'), ('country', 'Country')]
value_dimensions = [('unem', 'Unemployment'), ('capmob', 'Capital Mobility'),
                    ('gdp', 'GDP Growth'), ('trade', 'Trade')]
macro = hv.Table(macro_df, key_dimensions, value_dimensions)

display(macro_df.head())
Trying the holoviews way as in the example with stacked bars. This gives a legend, but it is not interactive.
bar_opts = dict(tools=['hover'], frame_width=600, xrotation=90, frame_height=400, color=hv.Cycle('Category20'))

bars = macro.to.bars(['Year', 'Country'], 'Trade', [])

bars.opts(opts.Bars(show_legend=True, legend_position='right', stacked=True, **bar_opts))
Then trying the hvplot path and it leads to pretty much the same results without the added formatting of dimension labels:
p_hvplot = macro_df.hvplot(kind='bar', x='year', y='trade', by='country', stacked=True).opts(**bar_opts)
p_hvplot
Finally, I am trying holoviews NdOverlay on a dictionary of bar charts for each country. This gives an interactive legend, but the bars do not stack, i.e. they are overlapping and hiding behind each other.
countries = macro_df['country'].unique()

(
    hv.NdOverlay({ctry: macro_df.loc[macro_df['country']==ctry].hvplot.bar(x='year', y='trade', stacked=True)
                  .aggregate(function=np.sum).opts(xrotation=90) for ctry in countries}, kdims='Countries')
    .opts(
        opts.NdOverlay(frame_height=400),
        opts.Bars(**bar_opts)
    )
)
Example of interacting through the legend below:

Anyone have a tip on how to get the bars to stack in an NdOverlay or is this out of scope? It would really be nice to have a way to mute different parts of a stacked bar chart through the legend be that through holoviews or hvplot.