I am working on a dashboard to explore a time-series dataset with a large number of variables. The means and variances of these variables span several orders of magnitude, so it would be convenient to rescale the corresponding axis when one of the variables is changed.
I cannot figure out a way to trigger such an action without rendering the figure unusable; I tried setting framewise=True on the shaded DynamicMap, but it doesn’t work with Datashader. My hypothesis is that zooming triggers a RangeXY stream event, which causes a new raster to be drawn, and the effect of framewise=True is to resize the axes to the data whenever the data changes. In other words, this creates a stabilizing feedback loop: a raster is drawn to fill the current frame, and then DynamicMap fits the frame to the current raster.
I believe this GitHub issue touches on the same problem. @jstevens had this suggestion:
I think you should be able to use a panel HoloViews pane to display the dynamicmap and force an update by setting the
objectparameter when you need it to redraw. Hope that points you in the right direction!
Unfortunately, after days of experimenting with watchers, streams, and param.depends(), I still can’t figure out how to access this parameter and ensure the corresponding axis is rescaled when (and only when) the “X” or “Y” parameters are changed.
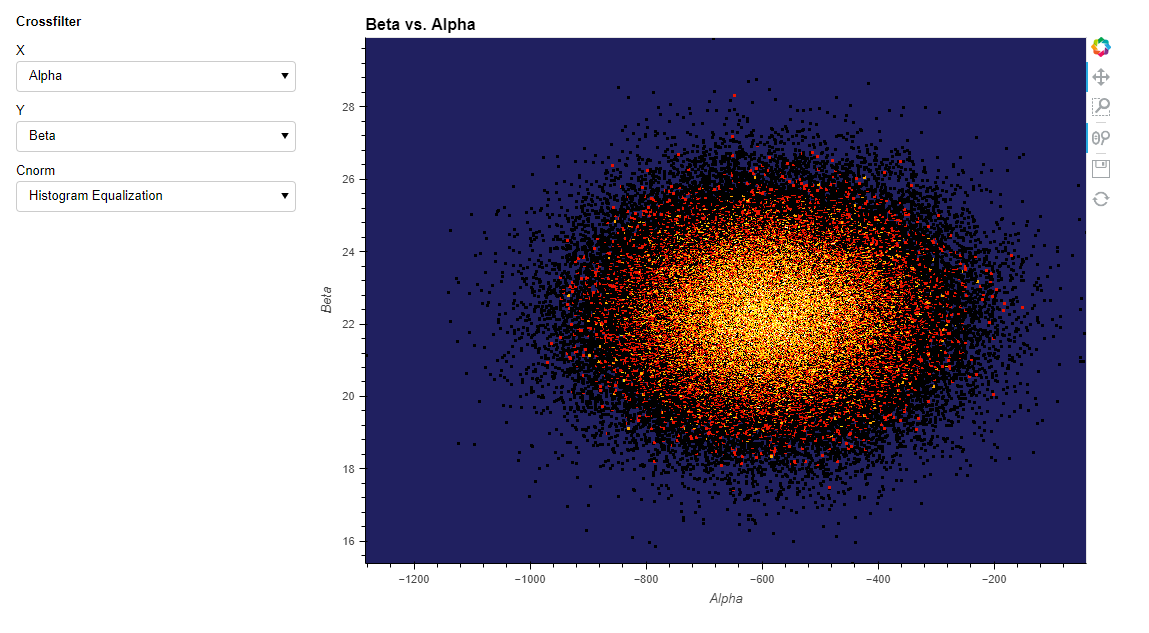
Below is a simplified example, with generated data. It’s inspired by Crossfilter — HoloViews v1.15.4 and by Dashboard — Examples 0.1.0 documentation (pyviz.org). I think the axis auto-ranging wasn’t an issue when I structured my application like the Crossfilter demo (with param.depends acting on a stateless function) but it became unwieldy as the number of customization widgets grew.
import numpy as np
import pandas as pd
import param as pm
import panel as pn
import holoviews as hv
import holoviews.operation.datashader as hvds
from scipy.stats import beta, multivariate_normal
from typing import Sequence

CNORM_OPTS = {
    'Histogram Equalization': 'eq_hist',
    'Linear Scale': 'linear',
    'Logarithmic Scale': 'log',
    'Cube-Root Scale': 'cbrt'
}

def make_data(columns: Sequence[str], nrows: int, seed: int=1) -> pd.DataFrame:
    rng = np.random.default_rng(seed)
    ncols = len(columns)
    corrs = 0.5*np.eye(ncols, dtype=np.float64)
    corr_dist = beta(a=2, b=2)
    corr_factors = corr_dist.rvs(size=6, random_state=rng)
    corrs[np.triu_indices_from(corrs, k=1)] = 2 * corr_factors - 1
    corrs = corrs + corrs.T

    mean_mag = np.power(10., rng.uniform(-3, 3, ncols))
    means = (-1)**rng.integers(0, 2, ncols) * mean_mag
    stds = np.exp(rng.uniform(-3, 0, ncols)) * mean_mag
    stddiag = np.diag(stds)
    cov = stddiag @ corrs @ stddiag

    mvnormal = multivariate_normal(mean=means, cov=cov)
    dframe = pd.DataFrame(
        data=mvnormal.rvs(size=nrows, random_state=rng),
        columns=columns
    )
    return dframe

class Crossfilter(pm.Parameterized):
    df = pm.DataFrame(precedence=-1)
    x  = pm.Selector()
    y  = pm.Selector()
    cnorm = pm.Selector(CNORM_OPTS)
    # style_opts = pm.Dict(precedence=-1)

    @pm.depends('df', watch=True)
    def _populate_xy(self, **kwargs):
        if self.df is None:
            return
        col_list = list(self.df.columns)
        self.param.x.objects = col_list
        self.param.y.objects = col_list
        self.x = self.param.x.objects[0]
        self.y = self.param.y.objects[1]

    @pm.depends('x','y')
    def elem(self):
        lbl = f'{self.y:s} vs. {self.x:s}'
        trace = hv.Points(self.df, [self.x, self.y], label=lbl)
        return trace

    def viewable(self, **kwargs):
        shaded = hvds.datashade(
            hv.DynamicMap(self.elem),
            cmap='fire',
            cnorm=self.param.cnorm,
            rescale_discrete_levels=False
        )
        spreaded = hvds.spread(shaded)
        style_opts = kwargs.get('style_opts', dict())
        pane = spreaded.apply.opts(**style_opts)
        return pane

    def get_panel(self, **kwargs):
        widgets = pn.Param(self.param, expand_button=False)
        figure = pn.Row(widgets, self.viewable(**kwargs))
        return figure

    def __init__(self, *args, **kwargs):
        super().__init__(*args, **kwargs)
        self.param.trigger('df')
cols = ['Alpha', 'Beta', 'Gamma', 'Delta']
crossfilt = Crossfilter(df=make_data(cols, 100000))
style_opts = dict(width=1200, height=800, bgcolor='#202060')
crossfilt.get_panel(style_opts=style_opts).show(port=12345)