Hi all!
I have the following dataframe
df = pd.DataFrame({'a': ['a', 'a', 'b', 'b', 'c'],
                   'b': ['x', 'y', 'z', 't', 'e'],
                   'r':range(5)
                  })
I want to build a bars plot with two levels along the x axis: columns a and b
hv.Bars(df, ['a', 'b'])
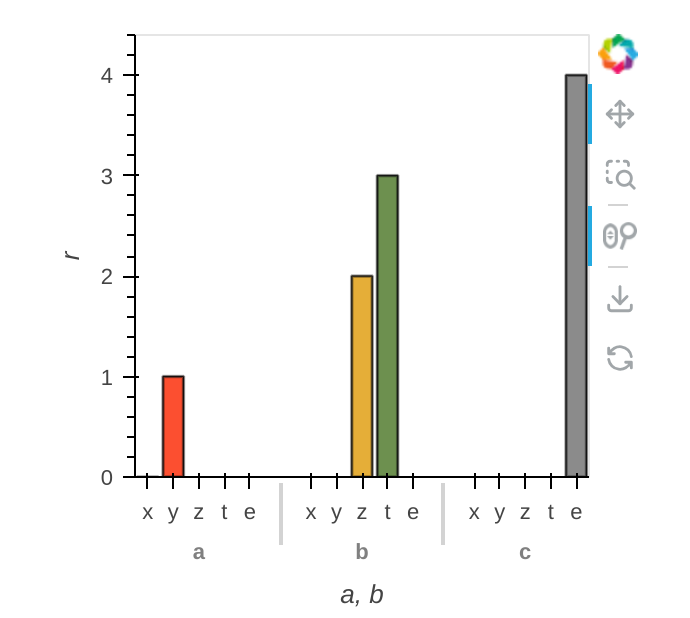
But each group in column a now has all the subgroups in column b that aren’t actually in the original dataframe!
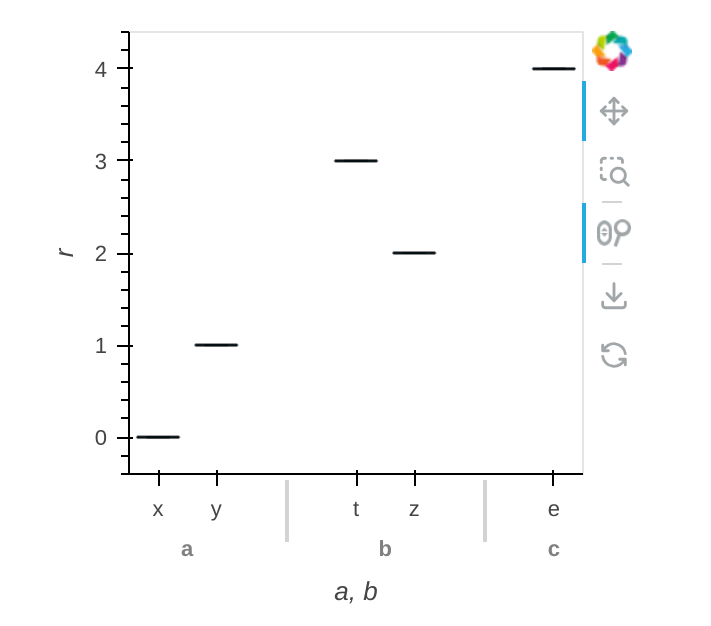
Now, if you build a boxwisker instead of bars, it will work as I expect! Please help me understand how I can get the same result with bars
hv.BoxWhisker(df, ['a', 'b'])