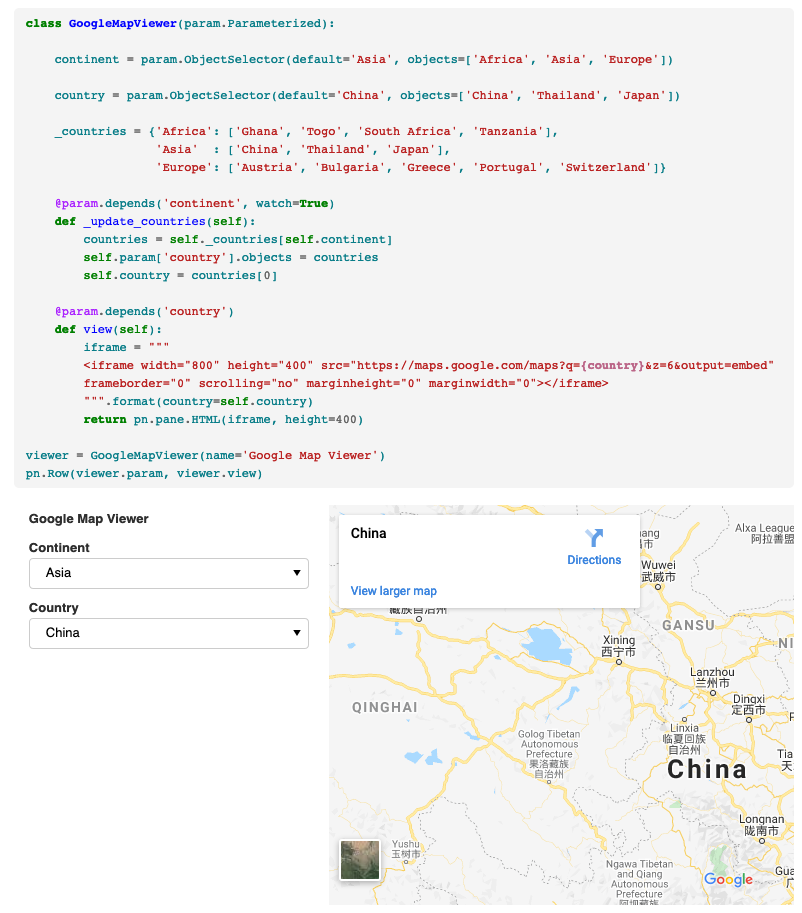
In the end, I went back to the GoogleMapViewer example in the User Guide.
Thanks @Marc and @ahuang11 for the suggestions, tips, and discussion.
This is a fully working solution.
App:
Code:
class ColormapsToyPlot(param.Parameterized):
    data = np.random.rand(8,8)

    collection = param.ObjectSelector(default='matplotlib', objects=['matplotlib', 'colorcet'])

    colormap = param.ObjectSelector(default='cubehelix', objects=sorted([
    'viridis', 'plasma', 'inferno', 'magma', 'cividis',
    'Greys', 'Purples', 'Blues', 'Greens', 'Oranges', 'Reds',
    'YlOrBr', 'YlOrRd', 'OrRd', 'PuRd', 'RdPu', 'BuPu',
    'GnBu', 'PuBu', 'YlGnBu', 'PuBuGn', 'BuGn', 'YlGn',
    'binary', 'gist_yarg', 'gist_gray', 'gray', 'bone', 'pink',
    'spring', 'summer', 'autumn', 'winter', 'cool', 'Wistia',
    'hot', 'afmhot', 'gist_heat', 'copper',
    'PiYG', 'PRGn', 'BrBG', 'PuOr', 'RdGy', 'RdBu',
    'RdYlBu', 'RdYlGn', 'Spectral', 'coolwarm', 'bwr', 'seismic',
    'flag', 'prism', 'ocean', 'gist_earth', 'terrain', 'gist_stern',
    'gnuplot', 'CMRmap', 'cubehelix', 'brg','gist_rainbow',
    'rainbow', 'jet', 'nipy_spectral', 'gist_ncar'
    'viridis_r', 'plasma_r', 'inferno_r', 'magma_r', 'cividis_r',
    'Greys_r', 'Purples_r', 'Blues_r', 'Greens_r', 'Oranges_r', 'Reds_r',
    'YlOrBr_r', 'YlOrRd_r', 'OrRd_r', 'PuRd_r', 'RdPu_r', 'BuPu_r',
    'GnBu_r', 'PuBu_r', 'YlGnBu_r', 'PuBuGn_r', 'BuGn_r', 'YlGn_r',
    'binary_r', 'gist_yarg_r', 'gist_gray_r', 'gray_r', 'bone_r', 'pink_r',
    'spring_r', 'summer_r', 'autumn_r', 'winter_r', 'cool_r', 'Wistia_r',
    'hot_r', 'afmhot_r', 'gist_heat_r', 'copper_r',
    'PiYG_r', 'PRGn_r', 'BrBG_r', 'PuOr_r', 'RdGy_r', 'RdBu_r',
    'RdYlBu_r', 'RdYlGn_r', 'Spectral_r', 'coolwarm_r', 'bwr_r', 'seismic_r',
    'flag_r', 'prism_r', 'ocean_r', 'gist_earth_r', 'terrain_r', 'gist_stern_r',
    'gnuplot_r', 'CMRmap_r', 'cubehelix_r', 'brg_r', 'gist_rainbow_r',
    'rainbow_r', 'jet_r', 'nipy_spectral_r', 'gist_ncar_r'], key=str.casefold))

    _colormaps = {'matplotlib': sorted([
    'viridis', 'plasma', 'inferno', 'magma', 'cividis',
    'Greys', 'Purples', 'Blues', 'Greens', 'Oranges', 'Reds',
    'YlOrBr', 'YlOrRd', 'OrRd', 'PuRd', 'RdPu', 'BuPu',
    'GnBu', 'PuBu', 'YlGnBu', 'PuBuGn', 'BuGn', 'YlGn',
    'binary', 'gist_yarg', 'gist_gray', 'gray', 'bone', 'pink',
    'spring', 'summer', 'autumn', 'winter', 'cool', 'Wistia',
    'hot', 'afmhot', 'gist_heat', 'copper',
    'PiYG', 'PRGn', 'BrBG', 'PuOr', 'RdGy', 'RdBu',
    'RdYlBu', 'RdYlGn', 'Spectral', 'coolwarm', 'bwr', 'seismic',
    'flag', 'prism', 'ocean', 'gist_earth', 'terrain', 'gist_stern',
    'gnuplot', 'CMRmap', 'cubehelix', 'brg','gist_rainbow',
    'rainbow', 'jet', 'nipy_spectral', 'gist_ncar'
    'viridis_r', 'plasma_r', 'inferno_r', 'magma_r', 'cividis_r',
    'Greys_r', 'Purples_r', 'Blues_r', 'Greens_r', 'Oranges_r', 'Reds_r',
    'YlOrBr_r', 'YlOrRd_r', 'OrRd_r', 'PuRd_r', 'RdPu_r', 'BuPu_r',
    'GnBu_r', 'PuBu_r', 'YlGnBu_r', 'PuBuGn_r', 'BuGn_r', 'YlGn_r',
    'binary_r', 'gist_yarg_r', 'gist_gray_r', 'gray_r', 'bone_r', 'pink_r',
    'spring_r', 'summer_r', 'autumn_r', 'winter_r', 'cool_r', 'Wistia_r',
    'hot_r', 'afmhot_r', 'gist_heat_r', 'copper_r',
    'PiYG_r', 'PRGn_r', 'BrBG_r', 'PuOr_r', 'RdGy_r', 'RdBu_r',
    'RdYlBu_r', 'RdYlGn_r', 'Spectral_r', 'coolwarm_r', 'bwr_r', 'seismic_r',
    'flag_r', 'prism_r', 'ocean_r', 'gist_earth_r', 'terrain_r', 'gist_stern_r',
    'gnuplot_r', 'CMRmap_r', 'cubehelix_r', 'brg_r', 'gist_rainbow_r',
    'rainbow_r', 'jet_r', 'nipy_spectral_r', 'gist_ncar_r'], key=str.casefold),
                  'colorcet': sorted([
    'cet_bgy', 'cet_bkr', 'cet_bgyw', 'cet_bky', 'cet_kbc', 'cet_coolwarm',
    'cet_blues', 'cet_gwv', 'cet_bmw', 'cet_bjy', 'cet_bmy', 'cet_bwy', 'cet_kgy',
    'cet_cwr', 'cet_gray', 'cet_dimgray', 'cet_fire', 'kb', 'cet_kg', 'cet_kr',
    'cet_colorwheel', 'cet_isolium', 'cet_rainbow', 'cet_bgy_r', 'cet_bkr_r',
    'cet_bgyw_r', 'cet_bky_r', 'cet_kbc_r', 'cet_coolwarm_r', 'cet_blues_r',
    'cet_gwv_r', 'cet_bmw_r', 'cet_bjy_r', 'cet_bmy_r', 'cet_bwy_r', 'cet_kgy_r',
    'cet_cwr_r', 'cet_gray_r', 'cet_dimgray_r', 'cet_fire_r', 'kb_r', 'cet_kg_r',
    'cet_kr_r', 'cet_colorwheel_r', 'cet_isolium_r', 'cet_rainbow_r'])}

    @param.depends('collection', watch=True)
    def _update_colormaps(self):
        colormaps = self._colormaps[self.collection]
        self.param['colormap'].objects = colormaps
        self.colormap = colormaps[0]

    @param.depends('colormap')
    def plot(self):
        fig = plt.figure()
        plt.imshow(self.data, self.colormap);
        plt.tight_layout()
        plt.colorbar()
        plt.close(fig=fig)
        return fig


viewer = ColormapsToyPlot(name='test')
pn.Row(viewer.param, viewer.plot)