Based on a Select widget update a second Select widget, then how to link the latter to a (reactive) plot?

I am trying to put together an app where user can:

  1. decide between colormap collections (for example between Matplotlib and Colorcet) using a Select widget
  2. based on the chosen collection pick a colormap using a second Select widget (for example, having chosen Matplotlib, pick cubehelix)
  3. have a Matplotlib plot of some data update to reflect the choice of colormap

The following is a “minimal” working example of my current code, up to where I get stuck (somewhere in the middle of part 3 above).

### preliminaries
import numpy as np
import matplotlib.pyplot as plt
import matplotlib.colors as clr
from matplotlib.figure import Figure
import matplotlib.cm as cm
import colorcet as cc
import panel as pn
pn.extension()

The part below is adapted from this example, already adapted from the User Guide.

Colormap collections:

### colormap collections
_colormaps = {
        'matplotlib': sorted([
        'viridis', 'plasma', 'inferno', 'magma', 'cividis',
        'Greys', 'Purples', 'Blues', 'Greens', 'Oranges', 'Reds',
        'YlOrBr', 'YlOrRd', 'OrRd', 'PuRd', 'RdPu', 'BuPu',
        'GnBu', 'PuBu', 'YlGnBu', 'PuBuGn', 'BuGn', 'YlGn',
        'binary', 'gist_yarg', 'gist_gray', 'gray', 'bone', 'pink',
        'spring', 'summer', 'autumn', 'winter', 'cool', 'Wistia',
        'hot', 'afmhot', 'gist_heat', 'copper', 
        'PiYG', 'PRGn', 'BrBG', 'PuOr', 'RdGy', 'RdBu',
        'RdYlBu', 'RdYlGn', 'Spectral', 'coolwarm', 'bwr', 'seismic',
        'flag', 'prism', 'ocean', 'gist_earth', 'terrain', 'gist_stern',
        'gnuplot', 'CMRmap', 'cubehelix', 'brg','gist_rainbow', 
        'rainbow', 'jet', 'nipy_spectral', 'gist_ncar'
        'viridis_r', 'plasma_r', 'inferno_r', 'magma_r', 'cividis_r',
        'Greys_r', 'Purples_r', 'Blues_r', 'Greens_r', 'Oranges_r', 'Reds_r',
        'YlOrBr_r', 'YlOrRd_r', 'OrRd_r', 'PuRd_r', 'RdPu_r', 'BuPu_r',
        'GnBu_r', 'PuBu_r', 'YlGnBu_r', 'PuBuGn_r', 'BuGn_r', 'YlGn_r',
        'binary_r', 'gist_yarg_r', 'gist_gray_r', 'gray_r', 'bone_r', 'pink_r',
        'spring_r', 'summer_r', 'autumn_r', 'winter_r', 'cool_r', 'Wistia_r',
        'hot_r', 'afmhot_r', 'gist_heat_r', 'copper_r', 
        'PiYG_r', 'PRGn_r', 'BrBG_r', 'PuOr_r', 'RdGy_r', 'RdBu_r',
        'RdYlBu_r', 'RdYlGn_r', 'Spectral_r', 'coolwarm_r', 'bwr_r', 'seismic_r',
        'flag_r', 'prism_r', 'ocean_r', 'gist_earth_r', 'terrain_r', 'gist_stern_r',
        'gnuplot_r', 'CMRmap_r', 'cubehelix_r', 'brg_r', 'gist_rainbow_r', 
        'rainbow_r', 'jet_r', 'nipy_spectral_r', 'gist_ncar_r'], key=str.casefold),    
        'colorcet': sorted([
        'cet_bgy', 'cet_bkr', 'cet_bgyw', 'cet_bky', 'cet_kbc', 'cet_coolwarm', 
        'cet_blues', 'cet_gwv', 'cet_bmw', 'cet_bjy', 'cet_bmy', 'cet_bwy', 'cet_kgy', 
        'cet_cwr', 'cet_gray', 'cet_dimgray', 'cet_fire', 'kb', 'cet_kg', 'cet_kr',
        'cet_colorwheel', 'cet_isolium', 'cet_rainbow', 'cet_bgy_r', 'cet_bkr_r', 
        'cet_bgyw_r', 'cet_bky_r', 'cet_kbc_r', 'cet_coolwarm_r', 'cet_blues_r', 
        'cet_gwv_r', 'cet_bmw_r', 'cet_bjy_r', 'cet_bmy_r', 'cet_bwy_r', 'cet_kgy_r', 
        'cet_cwr_r', 'cet_gray_r', 'cet_dimgray_r', 'cet_fire_r', 'kb_r', 'cet_kg_r', 
        'cet_kr_r', 'cet_colorwheel_r', 'cet_isolium_r', 'cet_rainbow_r'])
    }

Setting up widgets:

### Colormap collection drop-down
collection = pn.widgets.Select(value='matplotlib', 
                               options=['matplotlib', 'colorcet'])

### Colormap drop-down
    colormap = pn.widgets.Select(
        value=_colormaps[collection.value][0], 
        options=_colormaps[collection.value])

### depend decorator
@pn.depends(collection.param.value, watch=True)
    def _update_colormaps(collection):
        colormaps = _colormaps[collection]
        colormap.options = colormaps
        colormap.value = colormaps[0]

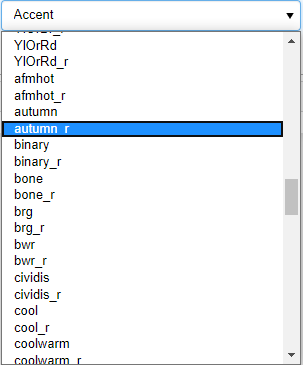
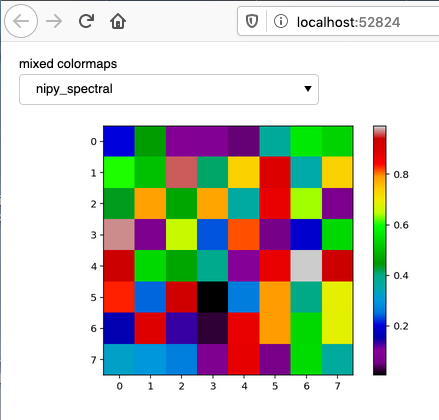
Here I lay out the two widgets in a row:

selection_widget = pn.Row(collection, colormap)
selection_widget

which, as expected, works:
select

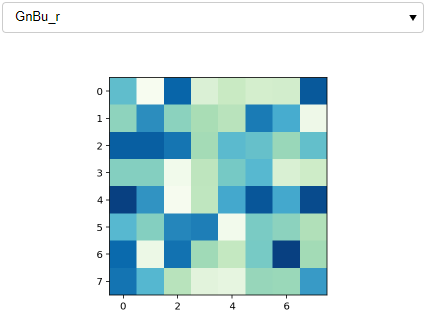
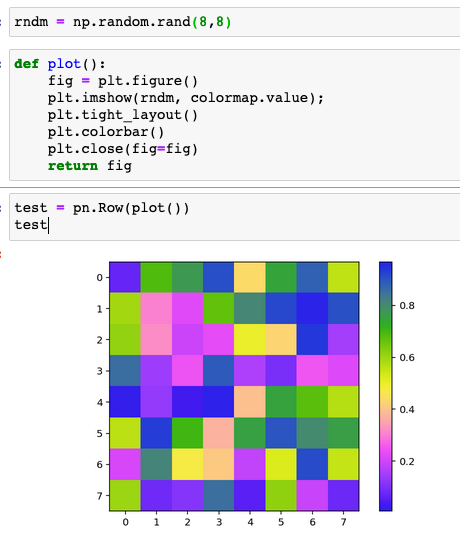
I then wrote this plot function, which works if I pass colormap.value (or even selection_widget[1].value) and uses as told the last selected colormap:

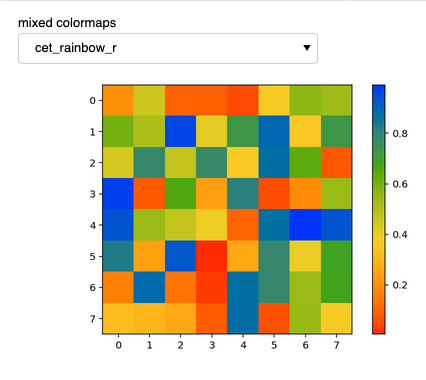
But things get really confusing as I want the plot to update live when the colormap is further changed. My first thought was to also wrap the plot function in a decorator, something like this:


Which does not do anything.

First question:

  1. if this is a viable solution, what am I doing wrong?

My second thought was to link the colormap Select widget to the plot. So I went back to the Scipy 2019 tutorial (video here) and started plating with it to see if I at least could get a string pane to update when the colormap is changed. That does not seem to work either.
string_test

I am reasonably sure it has to do with what is declared as value in the link (which seems to not always be clear, at least according to James i nthe video). So it looks like I am stuck.

I have two further questions:
2. Any suggestions (or pointers to existing examples) as to how to move forward with this specific case.
3. Is there any documentation on how to even look for what might be the appropriate “object” for links?

Final question / comment more general:
4. For someone who has a decent experience with functional programming and lots of visualization, but very green with other areas of Python, like making apps, I find it difficult to gage ahead of time (that is without getting oneself in a corner) what might be the right strategy, even with as good documentation ( I refer to this and this). Is it better to start simple and see where one get, or perhaps always aim to go for using param and get really good at it?
Thank you, all help appreciated.

Hi @mycarta

I’m not an experienced user of Matplotlib. I normally use other plotting libraries. But here are my observations.

  1. I think what you are doing wrong is that you expect the plt.imshow(rndm, colormap.value) to work when the colormap.value is a colorcet value. That will not work. Instead you need to get the colorcet colormap from the colormap.value and use that.
if self.collection == "colorcet" and self.color_map in cc.cm:
        color_map = cc.cm[self.color_map]
    else:
        color_map = self.color_map

(See working example below for more).

  1. See below.
  2. The problem in your case is not selecting an appropriate “object”.
  3. There is a learning path when getting into a new area like app building. The challenge as I see it here is that when you are new in an area you expect the problems to be coming from the new area. But here the problem is actually related to your use of matplotlib and colorcet. :slight_smile: But keep on fighting. Being able to communicate and productionize via data apps is a super power.

import numpy as np
import matplotlib.pyplot as plt
from matplotlib.figure import Figure
import colorcet as cc
import panel as pn
import param

COLLECTIONS = ["matplotlib", "colorcet"]

MATPLOTLIB_COLORMAPS = sorted(
    [
        "viridis",
        "plasma",
        "inferno",
        "magma",
        "cividis",
        "Greys",
        "Purples",
        "Blues",
        "Greens",
        "Oranges",
        "Reds",
        "YlOrBr",
        "YlOrRd",
        "OrRd",
        "PuRd",
        "RdPu",
        "BuPu",
        "GnBu",
        "PuBu",
        "YlGnBu",
        "PuBuGn",
        "BuGn",
        "YlGn",
        "binary",
        "gist_yarg",
        "gist_gray",
        "gray",
        "bone",
        "pink",
        "spring",
        "summer",
        "autumn",
        "winter",
        "cool",
        "Wistia",
        "hot",
        "afmhot",
        "gist_heat",
        "copper",
        "PiYG",
        "PRGn",
        "BrBG",
        "PuOr",
        "RdGy",
        "RdBu",
        "RdYlBu",
        "RdYlGn",
        "Spectral",
        "coolwarm",
        "bwr",
        "seismic",
        "flag",
        "prism",
        "ocean",
        "gist_earth",
        "terrain",
        "gist_stern",
        "gnuplot",
        "CMRmap",
        "cubehelix",
        "brg",
        "gist_rainbow",
        "rainbow",
        "jet",
        "nipy_spectral",
        "gist_ncar" "viridis_r",
        "plasma_r",
        "inferno_r",
        "magma_r",
        "cividis_r",
        "Greys_r",
        "Purples_r",
        "Blues_r",
        "Greens_r",
        "Oranges_r",
        "Reds_r",
        "YlOrBr_r",
        "YlOrRd_r",
        "OrRd_r",
        "PuRd_r",
        "RdPu_r",
        "BuPu_r",
        "GnBu_r",
        "PuBu_r",
        "YlGnBu_r",
        "PuBuGn_r",
        "BuGn_r",
        "YlGn_r",
        "binary_r",
        "gist_yarg_r",
        "gist_gray_r",
        "gray_r",
        "bone_r",
        "pink_r",
        "spring_r",
        "summer_r",
        "autumn_r",
        "winter_r",
        "cool_r",
        "Wistia_r",
        "hot_r",
        "afmhot_r",
        "gist_heat_r",
        "copper_r",
        "PiYG_r",
        "PRGn_r",
        "BrBG_r",
        "PuOr_r",
        "RdGy_r",
        "RdBu_r",
        "RdYlBu_r",
        "RdYlGn_r",
        "Spectral_r",
        "coolwarm_r",
        "bwr_r",
        "seismic_r",
        "flag_r",
        "prism_r",
        "ocean_r",
        "gist_earth_r",
        "terrain_r",
        "gist_stern_r",
        "gnuplot_r",
        "CMRmap_r",
        "cubehelix_r",
        "brg_r",
        "gist_rainbow_r",
        "rainbow_r",
        "jet_r",
        "nipy_spectral_r",
        "gist_ncar_r",
    ],
    key=str.casefold,
)

COLORSET_COLORMAPS = sorted(
    [
        "bgy",
        "bkr",
        "bgyw",
        "bky",
        "kbc",
        "coolwarm",
        "blues",
        "gwv",
        "bmw",
        "bjy",
        "bmy",
        "bwy",
        "kgy",
        "cwr",
        "gray",
        "dimgray",
        "fire",
        "kb",
        "kg",
        "kr",
        "colorwheel",
        "isolium",
        "rainbow",
        "bgy_r",
        "bkr_r",
        "bgyw_r",
        "bky_r",
        "kbc_r",
        "coolwarm_r",
        "blues_r",
        "gwv_r",
        "bmw_r",
        "bjy_r",
        "bmy_r",
        "bwy_r",
        "kgy_r",
        "cwr_r",
        "gray_r",
        "dimgray_r",
        "fire_r",
        "kb_r",
        "kg_r",
        "kr_r",
        "colorwheel_r",
        "isolium_r",
        "rainbow_r",
    ]
)
COLOR_MAPS = {"matplotlib": MATPLOTLIB_COLORMAPS, "colorcet": COLORSET_COLORMAPS}


class ColorApp(param.Parameterized):
    collection = param.ObjectSelector(default="matplotlib", objects=COLLECTIONS)
    color_map = param.ObjectSelector(default="viridis", objects=MATPLOTLIB_COLORMAPS)

    settings_pane = param.Parameter()
    plot_pane = param.Parameter()
    view = param.Parameter()

    def __init__(self, **params):
        params["settings_pane"] = pn.Param(
            self, parameters=["collection", "color_map"], show_name=False, width=300, background="grey"
        )
        params["plot_pane"] = pn.pane.Matplotlib(width=500, height=500)
        params["view"] = pn.Row(sizing_mode="stretch_width")

        super().__init__(**params)

        self.rndm = np.random.rand(8, 8)

        self.view[:] = [self.settings_pane, self.plot_pane]
        self._update_plot()

    @param.depends("collection", watch=True)
    def _update_color_map_parameters(self):
        print(f"update to {self.collection}")
        objects = COLOR_MAPS[self.collection]
        self.param.color_map.objects = objects

        default = objects[0]
        if self.param.color_map.default not in objects:
            self.param.color_map.default = default
        if self.color_map not in objects:
            self.color_map = default

        # hack to get drowdowns and plot to update ???
        # I should file an issue on Github
        self.settings_pane.object = self
        self.settings_pane.parameters = ["collection", "color_map"]
        self._update_plot()

    @param.depends("color_map", watch=True)
    def _update_plot(self):
        print("update plot")

        fig0 = Figure(figsize=(8, 6))
        ax0 = fig0.subplots()

        if self.collection == "colorcet" and self.color_map in cc.cm:
            color_map = cc.cm[self.color_map]
        else:
            color_map = self.color_map
        image = ax0.imshow(self.rndm, color_map)
        plt.tight_layout()
        plt.colorbar(image)
        fig = fig0
        self.plot_pane.object = fig


if __name__.startswith("bokeh"):
    ColorApp().view.servable()
else:
    ColorApp().view.show(port=5007)

1 Like

@Marc

Hi Marc,

Thanks so much for taking the time to answer all my questions, and for providing me with a full working example; I see you used Param: do you always go straight to it?

Either way, this will get me started with it! It is very useful to move further into a new area as you call it and see how someone else with a lot if experience thinks; I will read it, break it down, tinker with it, very valuable!

About the use of cmaps specifically, I am still confused.
I initially had your same thougth, because with Matplotlib you use quotes, but with Colorcet you do not. But then I read on the User Guide that:
“The same colormaps are also registered with Matplotlib’s string-based dictionary with the prefix cet_ , making them available by name within various matplotlib functions (e.g. cet_linear_kryw_0_100_c71 , cet_linear_kryw_0_100_c71_r , cet_fire , or cet_fire_r ).”

So, if I try this simpler example with only those Colorcet cmaps, it works, because I use colormap with the decorator. Is there no way to do it with both Matplotlib and Colorcet without using an if - else statement?
cet_only

import numpy as np
    import matplotlib.pyplot as plt
    import matplotlib.colors as clr
    import colorcet as cc

    import panel as pn
    pn.extension()

colormap = pn.widgets.Select(name='Colorcet colormap', options= sorted([
    'cet_bgy', 'cet_bkr', 'cet_bgyw', 'cet_bky', 'cet_kbc', 'cet_coolwarm', 
    'cet_blues', 'cet_gwv', 'cet_bmw', 'cet_bjy', 'cet_bmy', 'cet_bwy', 'cet_kgy', 
    'cet_cwr', 'cet_gray', 'cet_dimgray', 'cet_fire', 'kb', 'cet_kg', 'cet_kr',
    'cet_colorwheel', 'cet_isolium', 'cet_rainbow', 'cet_bgy_r', 'cet_bkr_r', 
    'cet_bgyw_r', 'cet_bky_r', 'cet_kbc_r', 'cet_coolwarm_r', 'cet_blues_r', 
    'cet_gwv_r', 'cet_bmw_r', 'cet_bjy_r', 'cet_bmy_r', 'cet_bwy_r', 'cet_kgy_r', 
    'cet_cwr_r', 'cet_gray_r', 'cet_dimgray_r', 'cet_fire_r', 'kb_r', 'cet_kg_r', 
    'cet_kr_r', 'cet_colorwheel_r', 'cet_isolium_r', 'cet_rainbow_r'], 
    key=str.casefold), value='cet_blues') 

selection_widget = pn.Row(colormap)

rndm = np.random.rand(8,8)

def plot(data, colormap):      
    fig = plt.figure()   
    plt.imshow(data, colormap); 
    plt.tight_layout() 
    plt.colorbar()
    plt.close(fig=fig)    
    return fig

@pn.depends(colormap) 
def reactive_plots(colormap):
    return plot(rndm, colormap)

pn.Column(selection_widget, reactive_plots).show() 

So I am still a bit unsure. Perhaps it is just a matter of choosing the wrong object?

By the way, I see you work for Ørsted, which is an interesting connection because I worked for DONG Energy in Stavanger, Norway, in 2012-2013.

1 Like

Regarding Matplotlib I’m not normally a user. I’ve tried to read the Colorcet documentation. But for me its a hard read and I can find an example illustrating how you expect it to work.

So I think we need help from an expert like @philippjfr

1 Like

This seems to work for me since it’s already registered in matplotlib’s colormaps, you can just call plt.colormaps to get both matplotlib and colorcet collections

import colorcet
import xarray as xr
import matplotlib.pyplot as plt
import panel as pn
pn.extension()

cmaps = plt.colormaps()
ds = xr.tutorial.open_dataset('air_temperature').isel(time=0)['air']

def plot(event):
    fig = plt.figure()
    ax = plt.axes()
    ds.plot(cmap=event.new, ax=ax)
    mpl_pane.object = fig

mpl_pane = pn.pane.Matplotlib()
select = pn.widgets.Select(options=cmaps)
_ = select.param.watch(plot, 'value')

pn.Column(select, mpl_pane)

ezgif.com-video-to-gif (3)

If you comment out import colorcet the colorcet cmaps no longer appear in the dropdown:
image

If you don’t have xarray; here’s the numpy version:

import colorcet
import matplotlib.pyplot as plt
import numpy as np
import panel as pn
pn.extension()

cmaps = plt.colormaps()
rndm = np.random.rand(8,8)

def plot(event):
    fig = plt.figure()
    ax = plt.axes()
    plt.imshow(rndm, event.new);
    mpl_pane.object = fig

mpl_pane = pn.pane.Matplotlib()
select = pn.widgets.Select(options=cmaps)
_ = select.param.watch(plot, 'value')

pn.Column(select, mpl_pane)

image

1 Like

Thank you @Marc, let’s see if @philippjfr has something to add.

Just to play my own devil’s advocate, this is an example with one colormap from each of Matplotlib and Colorcet, which works.

import numpy as np
import matplotlib.pyplot as plt
import matplotlib.colors as clr
import colorcet as cc

import panel as pn
pn.extension()

colormap = pn.widgets.Select(name='mixed colormaps', options= [
    'nipy_spectral', 'cet_rainbow_r'], value='nipy_spectral') 

selection_widget = pn.Row(colormap)

rndm = np.random.rand(8,8)

def plot(data, colormap):      
    fig = plt.figure()   
    plt.imshow(data, colormap); 
    plt.tight_layout() 
    plt.colorbar()
    plt.close(fig=fig)    
    return fig

@pn.depends(colormap)
def reactive_plots(colormap):
    return plot(rndm, colormap)

pn.Column(selection_widget, reactive_plots).show()  

mpl
cc

I could certainly simplify it this way, see my next example. I was hoping to offer the user the choice of separated collections, but perhaps this is a case of overthinking the app design, thanks for chipping in.

1 Like

Ah sorry, I didn’t read your requests completely. I think to remove the if/else statement, just need to prefix the colorcet cmaps with cet_

import colorcet
import numpy as np
import panel as pn
import matplotlib.pyplot as plt
pn.extension()

cc_cmaps = set('cet_' + cmap for cmap in colorcet.cm.keys())
mpl_cmaps = set(plt.colormaps()) - cc_cmaps
cmaps = {'matplotlib': sorted(mpl_cmaps), 'colorcet': sorted(cc_cmaps)}

def update_options(event):
    cmap_select.options = cmaps[event.new]

def plot(event):
    fig = plt.figure()
    plt.imshow(rndm, event.new);
    mpl_pane.object = fig

rndm = np.random.rand(8,8)
mpl_pane = pn.pane.Matplotlib()
lib_select = pn.widgets.Select(options=list(cmaps.keys()))
_ = lib_select.param.watch(update_options, 'value')

cmap_select = pn.widgets.Select(options=cmaps[lib_select.value])
_ = cmap_select.param.watch(plot, 'value')

pn.Column(lib_select, cmap_select, mpl_pane)

ezgif.com-video-to-gif (4)

3 Likes

This might be the solution, I will come back to it and try this evening. Interesting use of set by the way.

1 Like

I have a question, bear with me @ahuang11:
This is very close to what I am looking for, but is there any way to also have the behaviour in my initial example, that is to have the plot already present before any selection, with a predefined colormap?

In the end, I went back to the GoogleMapViewer example in the User Guide.

Thanks @Marc and @ahuang11 for the suggestions, tips, and discussion.

This is a fully working solution.

App:
Class_solution

Code:
class ColormapsToyPlot(param.Parameterized):

    data = np.random.rand(8,8)
    
    collection = param.ObjectSelector(default='matplotlib', objects=['matplotlib', 'colorcet'])
    
    colormap = param.ObjectSelector(default='cubehelix', objects=sorted([
    'viridis', 'plasma', 'inferno', 'magma', 'cividis',
    'Greys', 'Purples', 'Blues', 'Greens', 'Oranges', 'Reds',
    'YlOrBr', 'YlOrRd', 'OrRd', 'PuRd', 'RdPu', 'BuPu',
    'GnBu', 'PuBu', 'YlGnBu', 'PuBuGn', 'BuGn', 'YlGn',
    'binary', 'gist_yarg', 'gist_gray', 'gray', 'bone', 'pink',
    'spring', 'summer', 'autumn', 'winter', 'cool', 'Wistia',
    'hot', 'afmhot', 'gist_heat', 'copper', 
    'PiYG', 'PRGn', 'BrBG', 'PuOr', 'RdGy', 'RdBu',
    'RdYlBu', 'RdYlGn', 'Spectral', 'coolwarm', 'bwr', 'seismic',
    'flag', 'prism', 'ocean', 'gist_earth', 'terrain', 'gist_stern',
    'gnuplot', 'CMRmap', 'cubehelix', 'brg','gist_rainbow', 
    'rainbow', 'jet', 'nipy_spectral', 'gist_ncar'
    'viridis_r', 'plasma_r', 'inferno_r', 'magma_r', 'cividis_r',
    'Greys_r', 'Purples_r', 'Blues_r', 'Greens_r', 'Oranges_r', 'Reds_r',
    'YlOrBr_r', 'YlOrRd_r', 'OrRd_r', 'PuRd_r', 'RdPu_r', 'BuPu_r',
    'GnBu_r', 'PuBu_r', 'YlGnBu_r', 'PuBuGn_r', 'BuGn_r', 'YlGn_r',
    'binary_r', 'gist_yarg_r', 'gist_gray_r', 'gray_r', 'bone_r', 'pink_r',
    'spring_r', 'summer_r', 'autumn_r', 'winter_r', 'cool_r', 'Wistia_r',
    'hot_r', 'afmhot_r', 'gist_heat_r', 'copper_r', 
    'PiYG_r', 'PRGn_r', 'BrBG_r', 'PuOr_r', 'RdGy_r', 'RdBu_r',
    'RdYlBu_r', 'RdYlGn_r', 'Spectral_r', 'coolwarm_r', 'bwr_r', 'seismic_r',
    'flag_r', 'prism_r', 'ocean_r', 'gist_earth_r', 'terrain_r', 'gist_stern_r',
    'gnuplot_r', 'CMRmap_r', 'cubehelix_r', 'brg_r', 'gist_rainbow_r', 
    'rainbow_r', 'jet_r', 'nipy_spectral_r', 'gist_ncar_r'], key=str.casefold))
    
    _colormaps = {'matplotlib': sorted([
    'viridis', 'plasma', 'inferno', 'magma', 'cividis',
    'Greys', 'Purples', 'Blues', 'Greens', 'Oranges', 'Reds',
    'YlOrBr', 'YlOrRd', 'OrRd', 'PuRd', 'RdPu', 'BuPu',
    'GnBu', 'PuBu', 'YlGnBu', 'PuBuGn', 'BuGn', 'YlGn',
    'binary', 'gist_yarg', 'gist_gray', 'gray', 'bone', 'pink',
    'spring', 'summer', 'autumn', 'winter', 'cool', 'Wistia',
    'hot', 'afmhot', 'gist_heat', 'copper', 
    'PiYG', 'PRGn', 'BrBG', 'PuOr', 'RdGy', 'RdBu',
    'RdYlBu', 'RdYlGn', 'Spectral', 'coolwarm', 'bwr', 'seismic',
    'flag', 'prism', 'ocean', 'gist_earth', 'terrain', 'gist_stern',
    'gnuplot', 'CMRmap', 'cubehelix', 'brg','gist_rainbow', 
    'rainbow', 'jet', 'nipy_spectral', 'gist_ncar'
    'viridis_r', 'plasma_r', 'inferno_r', 'magma_r', 'cividis_r',
    'Greys_r', 'Purples_r', 'Blues_r', 'Greens_r', 'Oranges_r', 'Reds_r',
    'YlOrBr_r', 'YlOrRd_r', 'OrRd_r', 'PuRd_r', 'RdPu_r', 'BuPu_r',
    'GnBu_r', 'PuBu_r', 'YlGnBu_r', 'PuBuGn_r', 'BuGn_r', 'YlGn_r',
    'binary_r', 'gist_yarg_r', 'gist_gray_r', 'gray_r', 'bone_r', 'pink_r',
    'spring_r', 'summer_r', 'autumn_r', 'winter_r', 'cool_r', 'Wistia_r',
    'hot_r', 'afmhot_r', 'gist_heat_r', 'copper_r', 
    'PiYG_r', 'PRGn_r', 'BrBG_r', 'PuOr_r', 'RdGy_r', 'RdBu_r',
    'RdYlBu_r', 'RdYlGn_r', 'Spectral_r', 'coolwarm_r', 'bwr_r', 'seismic_r',
    'flag_r', 'prism_r', 'ocean_r', 'gist_earth_r', 'terrain_r', 'gist_stern_r',
    'gnuplot_r', 'CMRmap_r', 'cubehelix_r', 'brg_r', 'gist_rainbow_r', 
    'rainbow_r', 'jet_r', 'nipy_spectral_r', 'gist_ncar_r'], key=str.casefold),
                  'colorcet': sorted([
    'cet_bgy', 'cet_bkr', 'cet_bgyw', 'cet_bky', 'cet_kbc', 'cet_coolwarm', 
    'cet_blues', 'cet_gwv', 'cet_bmw', 'cet_bjy', 'cet_bmy', 'cet_bwy', 'cet_kgy', 
    'cet_cwr', 'cet_gray', 'cet_dimgray', 'cet_fire', 'kb', 'cet_kg', 'cet_kr',
    'cet_colorwheel', 'cet_isolium', 'cet_rainbow', 'cet_bgy_r', 'cet_bkr_r', 
    'cet_bgyw_r', 'cet_bky_r', 'cet_kbc_r', 'cet_coolwarm_r', 'cet_blues_r', 
    'cet_gwv_r', 'cet_bmw_r', 'cet_bjy_r', 'cet_bmy_r', 'cet_bwy_r', 'cet_kgy_r', 
    'cet_cwr_r', 'cet_gray_r', 'cet_dimgray_r', 'cet_fire_r', 'kb_r', 'cet_kg_r', 
    'cet_kr_r', 'cet_colorwheel_r', 'cet_isolium_r', 'cet_rainbow_r'])}
    
    @param.depends('collection', watch=True)
    def _update_colormaps(self):
        colormaps = self._colormaps[self.collection]
        self.param['colormap'].objects = colormaps
        self.colormap = colormaps[0]

    @param.depends('colormap')  
    def plot(self):      
        fig = plt.figure()   
        plt.imshow(self.data, self.colormap); 
        plt.tight_layout() 
        plt.colorbar()
        plt.close(fig=fig)    
        return fig

        
viewer = ColormapsToyPlot(name='test')
pn.Row(viewer.param, viewer.plot)
2 Likes

Curious if watch=True is necessary here since you don’t set self.collection manually.

1 Like

It looks like it is necessary; this is the behaviour if it is not included:
no_watch
So the update only happens when the Colormap is set, not the Collection; in fact, the collection is stuck at Matplotlib.

1 Like