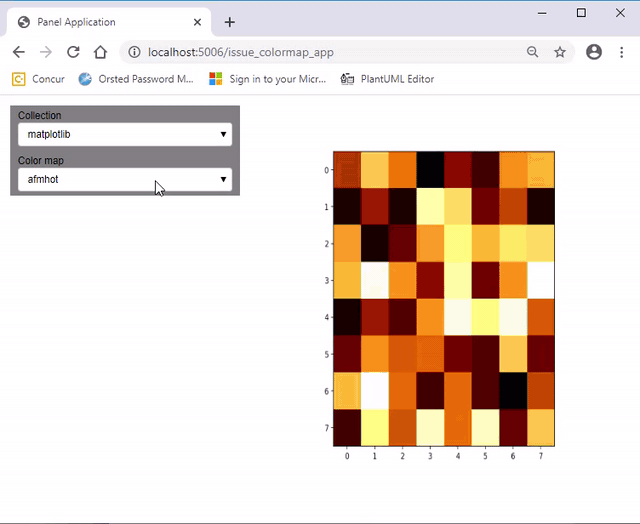
Hi @mycarta
I’m not an experienced user of Matplotlib. I normally use other plotting libraries. But here are my observations.
- I think what you are doing wrong is that you expect the
plt.imshow(rndm, colormap.value)to work when thecolormap.valueis a colorcet value. That will not work. Instead you need to get the colorcet colormap from thecolormap.valueand use that.
if self.collection == "colorcet" and self.color_map in cc.cm:
        color_map = cc.cm[self.color_map]
    else:
        color_map = self.color_map
(See working example below for more).
- See below.
- The problem in your case is not selecting an appropriate “object”.
- There is a learning path when getting into a new area like app building. The challenge as I see it here is that when you are new in an area you expect the problems to be coming from the new area. But here the problem is actually related to your use of matplotlib and colorcet.
 But keep on fighting. Being able to communicate and productionize via data apps is a super power.
import numpy as np
import matplotlib.pyplot as plt
from matplotlib.figure import Figure
import colorcet as cc
import panel as pn
import param

COLLECTIONS = ["matplotlib", "colorcet"]

MATPLOTLIB_COLORMAPS = sorted(
    [
        "viridis",
        "plasma",
        "inferno",
        "magma",
        "cividis",
        "Greys",
        "Purples",
        "Blues",
        "Greens",
        "Oranges",
        "Reds",
        "YlOrBr",
        "YlOrRd",
        "OrRd",
        "PuRd",
        "RdPu",
        "BuPu",
        "GnBu",
        "PuBu",
        "YlGnBu",
        "PuBuGn",
        "BuGn",
        "YlGn",
        "binary",
        "gist_yarg",
        "gist_gray",
        "gray",
        "bone",
        "pink",
        "spring",
        "summer",
        "autumn",
        "winter",
        "cool",
        "Wistia",
        "hot",
        "afmhot",
        "gist_heat",
        "copper",
        "PiYG",
        "PRGn",
        "BrBG",
        "PuOr",
        "RdGy",
        "RdBu",
        "RdYlBu",
        "RdYlGn",
        "Spectral",
        "coolwarm",
        "bwr",
        "seismic",
        "flag",
        "prism",
        "ocean",
        "gist_earth",
        "terrain",
        "gist_stern",
        "gnuplot",
        "CMRmap",
        "cubehelix",
        "brg",
        "gist_rainbow",
        "rainbow",
        "jet",
        "nipy_spectral",
        "gist_ncar" "viridis_r",
        "plasma_r",
        "inferno_r",
        "magma_r",
        "cividis_r",
        "Greys_r",
        "Purples_r",
        "Blues_r",
        "Greens_r",
        "Oranges_r",
        "Reds_r",
        "YlOrBr_r",
        "YlOrRd_r",
        "OrRd_r",
        "PuRd_r",
        "RdPu_r",
        "BuPu_r",
        "GnBu_r",
        "PuBu_r",
        "YlGnBu_r",
        "PuBuGn_r",
        "BuGn_r",
        "YlGn_r",
        "binary_r",
        "gist_yarg_r",
        "gist_gray_r",
        "gray_r",
        "bone_r",
        "pink_r",
        "spring_r",
        "summer_r",
        "autumn_r",
        "winter_r",
        "cool_r",
        "Wistia_r",
        "hot_r",
        "afmhot_r",
        "gist_heat_r",
        "copper_r",
        "PiYG_r",
        "PRGn_r",
        "BrBG_r",
        "PuOr_r",
        "RdGy_r",
        "RdBu_r",
        "RdYlBu_r",
        "RdYlGn_r",
        "Spectral_r",
        "coolwarm_r",
        "bwr_r",
        "seismic_r",
        "flag_r",
        "prism_r",
        "ocean_r",
        "gist_earth_r",
        "terrain_r",
        "gist_stern_r",
        "gnuplot_r",
        "CMRmap_r",
        "cubehelix_r",
        "brg_r",
        "gist_rainbow_r",
        "rainbow_r",
        "jet_r",
        "nipy_spectral_r",
        "gist_ncar_r",
    ],
    key=str.casefold,
)

COLORSET_COLORMAPS = sorted(
    [
        "bgy",
        "bkr",
        "bgyw",
        "bky",
        "kbc",
        "coolwarm",
        "blues",
        "gwv",
        "bmw",
        "bjy",
        "bmy",
        "bwy",
        "kgy",
        "cwr",
        "gray",
        "dimgray",
        "fire",
        "kb",
        "kg",
        "kr",
        "colorwheel",
        "isolium",
        "rainbow",
        "bgy_r",
        "bkr_r",
        "bgyw_r",
        "bky_r",
        "kbc_r",
        "coolwarm_r",
        "blues_r",
        "gwv_r",
        "bmw_r",
        "bjy_r",
        "bmy_r",
        "bwy_r",
        "kgy_r",
        "cwr_r",
        "gray_r",
        "dimgray_r",
        "fire_r",
        "kb_r",
        "kg_r",
        "kr_r",
        "colorwheel_r",
        "isolium_r",
        "rainbow_r",
    ]
)
COLOR_MAPS = {"matplotlib": MATPLOTLIB_COLORMAPS, "colorcet": COLORSET_COLORMAPS}


class ColorApp(param.Parameterized):
    collection = param.ObjectSelector(default="matplotlib", objects=COLLECTIONS)
    color_map = param.ObjectSelector(default="viridis", objects=MATPLOTLIB_COLORMAPS)

    settings_pane = param.Parameter()
    plot_pane = param.Parameter()
    view = param.Parameter()

    def __init__(self, **params):
        params["settings_pane"] = pn.Param(
            self, parameters=["collection", "color_map"], show_name=False, width=300, background="grey"
        )
        params["plot_pane"] = pn.pane.Matplotlib(width=500, height=500)
        params["view"] = pn.Row(sizing_mode="stretch_width")

        super().__init__(**params)

        self.rndm = np.random.rand(8, 8)

        self.view[:] = [self.settings_pane, self.plot_pane]
        self._update_plot()

    @param.depends("collection", watch=True)
    def _update_color_map_parameters(self):
        print(f"update to {self.collection}")
        objects = COLOR_MAPS[self.collection]
        self.param.color_map.objects = objects

        default = objects[0]
        if self.param.color_map.default not in objects:
            self.param.color_map.default = default
        if self.color_map not in objects:
            self.color_map = default

        # hack to get drowdowns and plot to update ???
        # I should file an issue on Github
        self.settings_pane.object = self
        self.settings_pane.parameters = ["collection", "color_map"]
        self._update_plot()

    @param.depends("color_map", watch=True)
    def _update_plot(self):
        print("update plot")

        fig0 = Figure(figsize=(8, 6))
        ax0 = fig0.subplots()

        if self.collection == "colorcet" and self.color_map in cc.cm:
            color_map = cc.cm[self.color_map]
        else:
            color_map = self.color_map
        image = ax0.imshow(self.rndm, color_map)
        plt.tight_layout()
        plt.colorbar(image)
        fig = fig0
        self.plot_pane.object = fig


if __name__.startswith("bokeh"):
    ColorApp().view.servable()
else:
    ColorApp().view.show(port=5007)